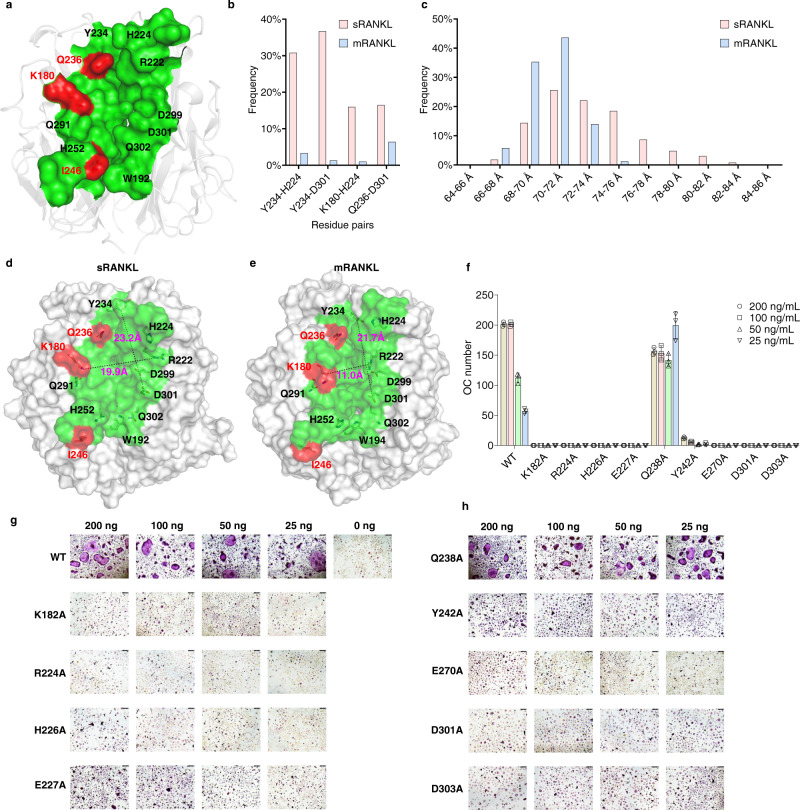
Fig. 1. Evidence for selective sRANKL inhibition binding site identification.
a Proposed small molecule binding site that can be used to distinguish sRANKL from mRANKL. b he probabilities that distances of residue pairs greater than 1.8 Å in sRANKL (red) and mRANKL (blue). The data are calculated based on conformation trajectories from 100 ns MD simulations on sRANKL and mRANKL. c SDRP frequency in sRANKL and mRANKL. d, e The distance of Y236-D303 and K182-R224 in sRANKL and mRANKL after MD simulation. f, g and h Osteoclastogenesis function of single-point mutated rat sRANKL and WT sRANKL. Representative TRAP staining images from one well each, with triplicate repeats wells of BMM cells isolated from C57BL/6 mice cultured with colony-stimulating factor 1 (M-CSF (10 ng/mL) and either varying WT sRANKL or mutated sRANKL (25–200 ng/mL). The number of osteoclasts counted in the osteoclastogenesis assay with mutated sRANKL. Data were presented as group mean ± s.d., n = 3 biological replicates.

