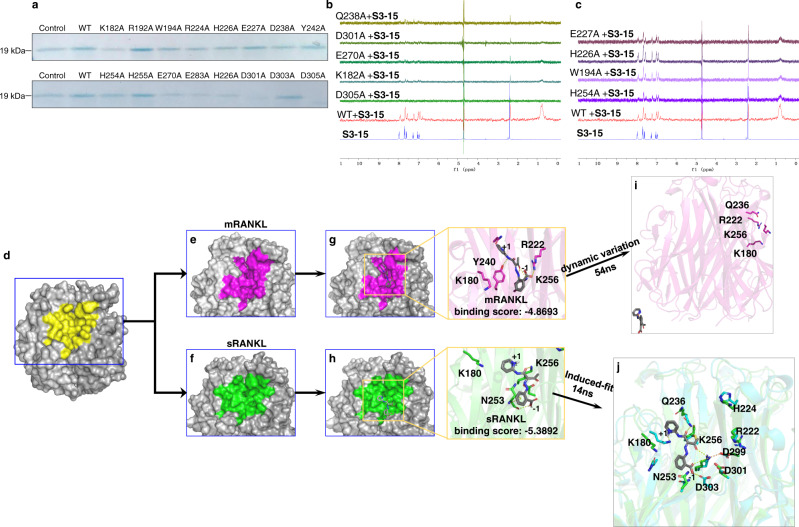
Fig. 4. Binding models identification of selective sRANKL inhibition.
a The pull-down assay results showing the binding affinities of S3-15 and rat sRANKL mutants. The pull-down proteins by S3-15 were observed by Coomassie blue staining. A dimmed band means the interaction of S3-15 and some mutants are weakened. b 1H-NMR STD transfer were not observed spectral shift, indicating Q238, D301, E270, K182, and D305 sesidues are key residues of rat sRANKL to the interaction of S3-15 and sRANKL. c 1H-NMR STD transfer were observed, indicating E227, H226, W194, and H254 do not contribute to the interaction of S3-15 and of rat sRANKL. d The binding surface (yellow) of sRANKL (PDB ID: 1S55). e, f The binding surface of mRANKL (purple) and sRANKL (green). The purple area is shrunken (compared with the yellow area) due to the residues near by the membrane are fixed. The green area is expanded (compared with the yellow area) because sRANKL has no residues restricted by membrane. g MD simulations show that the complex of S3-15-mRANKL is not stable. S3-15 was expelled from the binding site (purple area) after 54 ns MD simulations. h The complex of S3-15-sRANKL becomes more stable after 14 ns MD simulations (cyan color in right photo). S3-15 has stronger binding in the binding site (green area) due to the induced-fit. H-bonds are presented as yellow dashed lines. i The overview of S3-15-mRANKL complex after 54ns MD simulations. j The overlay of S3-15-sRANKL after 14ns MD simulations and sRANKL.

