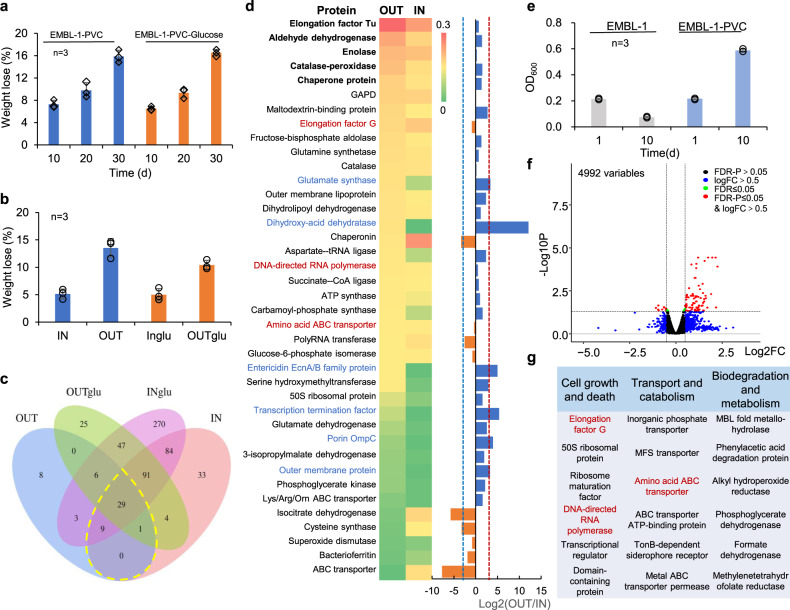
Fig. 4. Proteomic and transcriptomic analyses of PVC-degrading metabolic functions of strain EMBL-1.
a, b The weight loss of PVC film under the action of strain EMBL-1 without and with glucose (glu) as supplementary carbon source (a) and four intracellular (IN) or extracellular (OUT) protein extracts under in vitro conditions (b). c Venn diagram showing shared and unique proteins in the protein extracts; d 39 proteins involved in intracellular and extracellular metabolism of the PVC film. The heatmap showed the relative abundance of 39 proteins in the proteome, while bar chart depicts just uses the values of fold change from value to visually display the changes in the intracellular and extracellular to intracellular samples. The five most abundant proteins in the OUT extracts from heatmap were marked in bold, while those that were more upregulated in the OUT extracts than in the IN extracts from bar chart depicts (Log2OUT/IN ≥ 8) were marked in blue. The proteins marked in red were detected in both proteomes and transcriptomes. e EMBL-1 cell density (as OD600) using PVC film as the sole carbon source. f Volcano map showing protein-coding genes (red spheres) that were significantly upregulated in the PVC group compared with the control group. The quasi-likelihood F test (glmTreat function in edgeR) was used to identify differential genes in two groups. The Benjamini–Hochberg method was used to adjust P values for multiple testing. g Functional annotation of upregulated genes, with the genes marked in red being those that were also detected in the proteomes. The proteins marked in red were detected in both proteomes and transcriptomes. For a, b, e, each experimental group was conducted in triplicate, the mean values (±standard deviation) were visualized, and source data were provided as a Source Data file.

