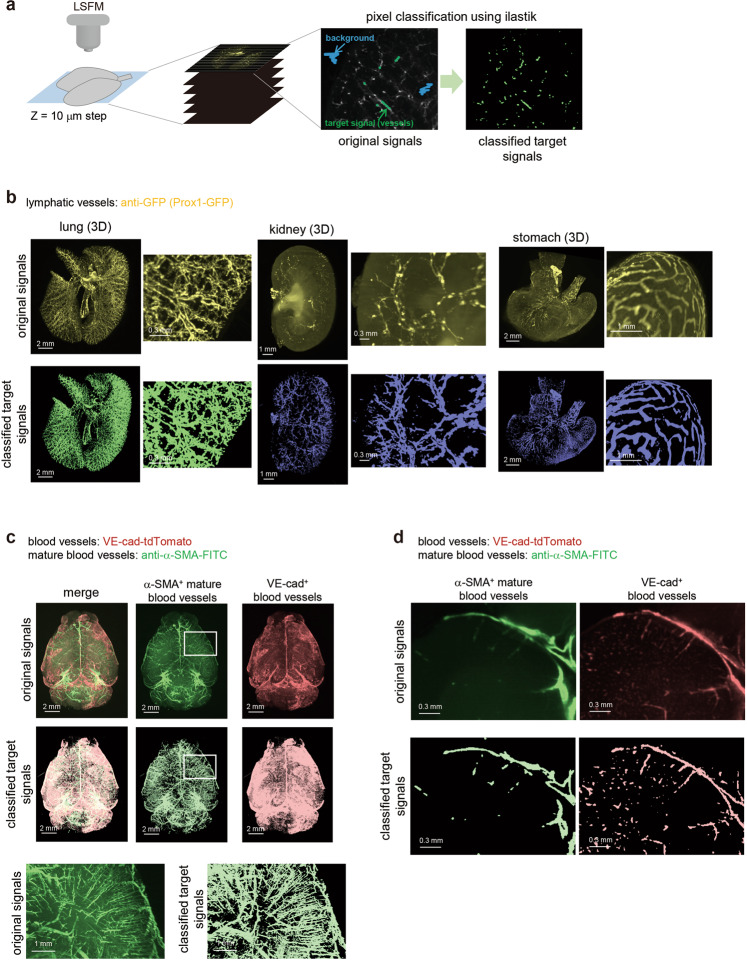
Fig. 3. Evaluation of 3D images with computational training.
a Overview of analysis procedure of pixel classification. The 3D images of transparent samples were captured by LSFM. The captured tiff images were converted to hdf5 format using python. Target signals such as vasculature or cancer cells were classified by machine training with ilastik software. In this study, two classes (target signal and background) were defined for the classification. b The images of the original signals and classified target signals after training by ilastik. The 3D whole-organ images of the original fluorescent signals (upper) and classified signals after machine learning (lower) are shown (lung, kidney, and stomach). The sample of the lung is originated from control#1 in Fig. 7. The enlarged 3D images are shown next to whole-organ images. c and d The 3D and 2D (XY) images of original and classified signals of the blood vessels in the brain. The 3D whole-brain images of α-SMA+ mature blood vessels (middle), VE-cad+ blood capillaries (right) and their merge images (left) are shown (c). Both images with original signals (upper) and classified signals (lower) are shown. The enlarged 3D images of α-SMA+ mature blood vessels in the white insets are shown (bottom). The 2D (XY) images are also shown (d). Both images with original signals (upper) and classified signals (lower) are shown.

