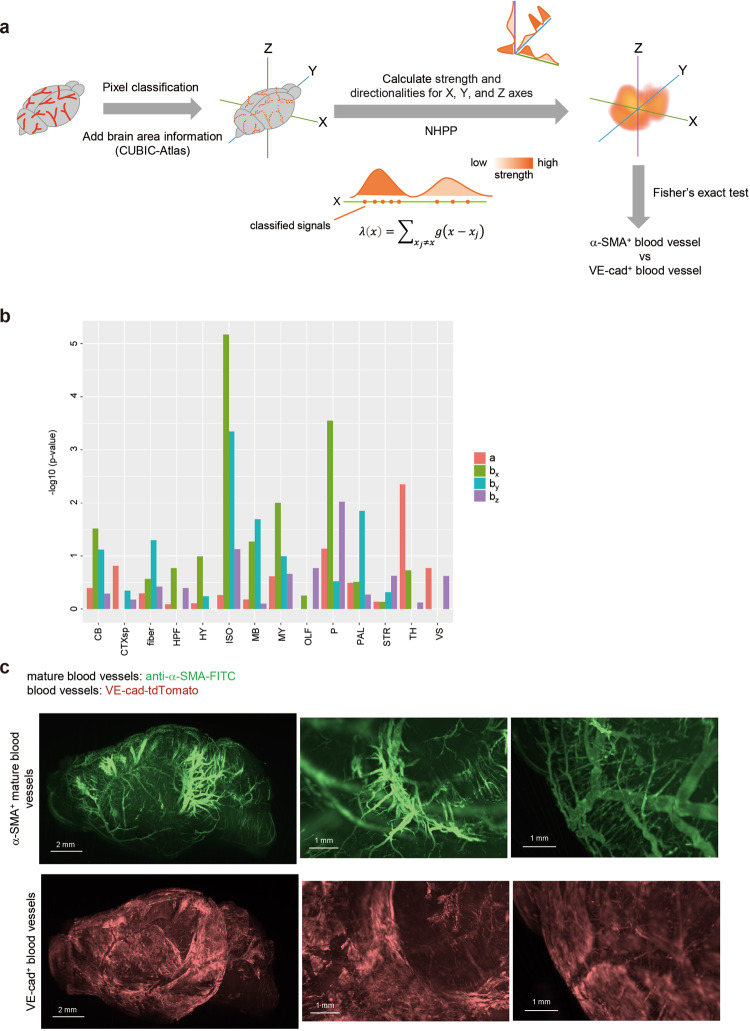
Fig. 4. Analysis of brain blood vessels using NHPP.
a Overview of analysis procedure using CUBIC-Atlas and NHPP. First, signals of blood vessels were classified using ilastik software, then the brain anatomical information is added to them using ANTs and CUBIC-Atlas. To evaluate the intensities of blood vessels, non-homogeneous Poisson process (NHPP) was applied. In this method, strength (a) and directionalities (bx, by, bz) can be calculated using the pixel-based classified signals as the points. To compare the difference between α-SMA+ mature blood vessels and VE-cad+ blood capillaries, Fisher’s exact test (two-sided) was used. b The result of Fisher’s exact test between α-SMA+ mature blood vessels and VE-cad+ blood capillaries in mouse brain. Strength (a) and directionalities (bx, by, bz) were calculated using NHPP and the results of NHPP in each brain area were used in the Fisher’s exact test (14 brain areas: cerebellum (CB), cortical subplate (CTXsp), fiber tracts (fiber), hippocampal formation (HPF), hypothalamus (HY), isocortex (ISO), midbrain (MB), medulla (MY), olfactory areas (OLF), pons (P), pallidum (PAL), striatum (STR), thalamus (TH), and ventricular systems (VS)). P < 0.05 means that the intensity or the directionality of α-SMA+ signals are statistically higher than those of VE-cad+ signals. Four independent mouse brains (female, 6-15 months) were used for analysis (see Supplementary Fig. 4). Source data are provided as a Source Data file. c The 3D images of the original images with α-SMA+ and VE-cad+ signals in the brain. The representative 3D whole-brain images (left, sagittal view, YZ), the enlarged 3D images in the midbrain and pons areas (middle), and in the surface of isocortex area (right) are shown.

