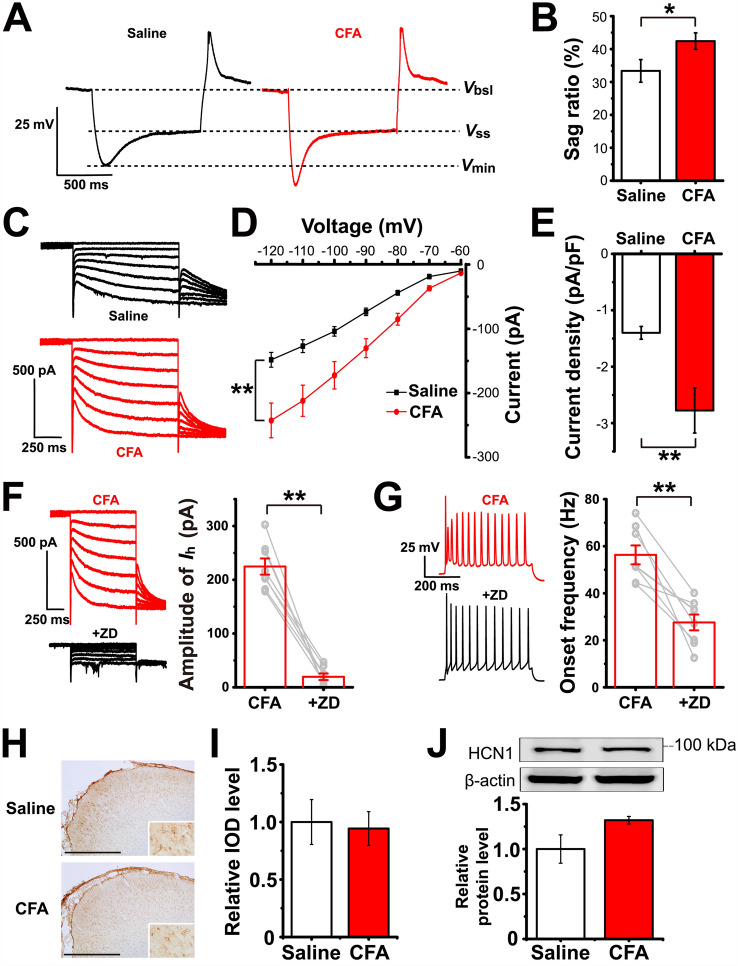
Fig. 3.
Ih of LEC fan cells is up-regulated after CFA injection. A Representative traces of voltage sag induced by a current step that causes an approximately − 20 mV hyperpolarization at the steady state. Vbsl, baseline voltage; Vss, steady-state voltage; Vmin, minimum voltage. B Voltage sag ratios in the saline and CFA groups. C Representative traces of Ih induced by applying 1-s hyperpolarizing voltage steps from − 60 to − 120 mV (in 10-mV steps). D Current-voltage relationships of Ih in LEC fan cells from the saline and CFA groups. E Ih density at − 120 mV. F Ih is blocked after bath application of 10 µmol/L ZD7288 in LEC fan cells of the CFA group. G Onset frequency of the fan cells in F is significantly reduced after bath application of 10 µmol/L ZD7288. Left panel, representative traces showing that the onset frequency is measured between the 1st and 2nd AP elicited by a 200-pA depolarizing stimulus. H Representative immunohistochemistry images showing the expression pattern of HCN1 in the LEC (scale bar, 500 µm). Inserts, magnified images of HCN1-positive cells. I Relative IOD levels of HCN1 in the LEC are almost identical in the saline and CFA groups, as shown by immunohistochemistry. The IOD levels are expressed as a fold increase compared with the mean of the saline group in this and the following figures in this format. J Western blots and analysis of HCN1 expression levels in the saline and CFA groups. The relative protein levels are normalized as a ratio of β-actin levels and expressed as fold increase compared with the mean of the saline group in all Western blot figures. *P < 0.05, **P < 0.01.

