Fig. 7.
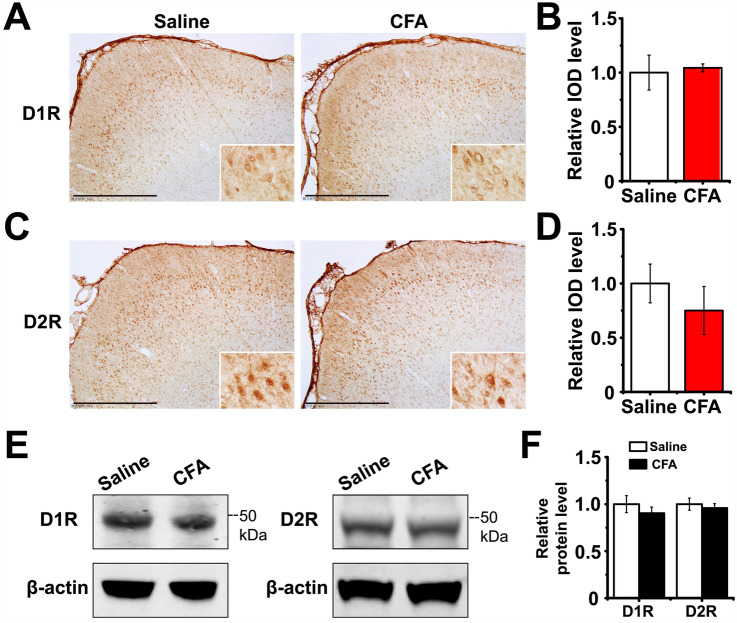
The expression level of D1R and D2R in LEC do not change after CFA injection. A Representative immunohistochemistry images showing the expression pattern of D1R in the LEC (scale bars, 500 µm; inserts, magnified images of D1R-positive cells). B Relative IOD levels of D1R in the LEC are almost identical in the saline and CFA groups, as shown by immunohistochemistry. C Representative immunohistochemistry images showing the expression pattern of D2R in the LEC (scale bars, 500 µm; inserts, magnified images of the D2R-positive cells.) D Relative IOD levels of D2R in the LEC are almost identical in the saline and CFA groups, as shown by immunohistochemistry. E Representative images showing the protein expression of D1R and D2R in the LEC in the saline and CFA groups. F Western blot analysis of D1R and D2R expression levels in the saline and CFA groups.

