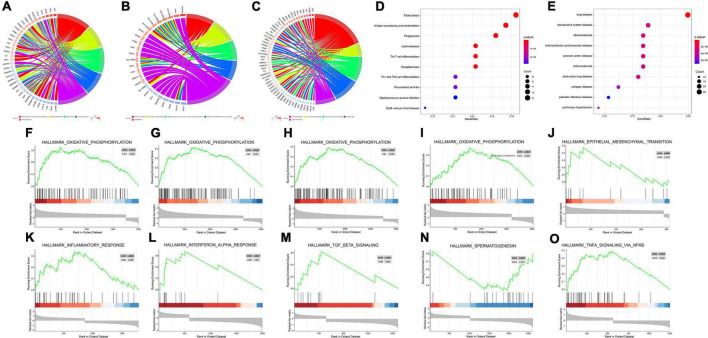
FIGURE 3.
Enrichment analyses (GO, KEGG, DO, GSEA) of immune DEGs. (A) Circos diagram depicting GO-BP Enrichment analysis. (B) Circos diagram depicting GO-CC Enrichment analysis. (C) Circos diagram depicting GO-MF Enrichment analysis. (D) Dot plot depicting KEGG Enrichment analysis. (E) Dot plot depicting DO Enrichment analysis. (F–O) Signal-gene gene set enrichment analysis (GSEA) indicating statistically significant enrichment from AD and normal tissues, and representative hallmarks. (F) APLNR in GSE5281. (G) CHGB in GSE5281. (H) FGF13 in GSE5281. (I) PAK1 in GSE5281. (J) CHGB in GSE28146. (K) APLNR in GSE48350. (L) CHGB in GSE48350. (M) FGF13 in GSE48350. (N) PAK1 in GSE48350. (O) SERPINA3 in GSE48350.

