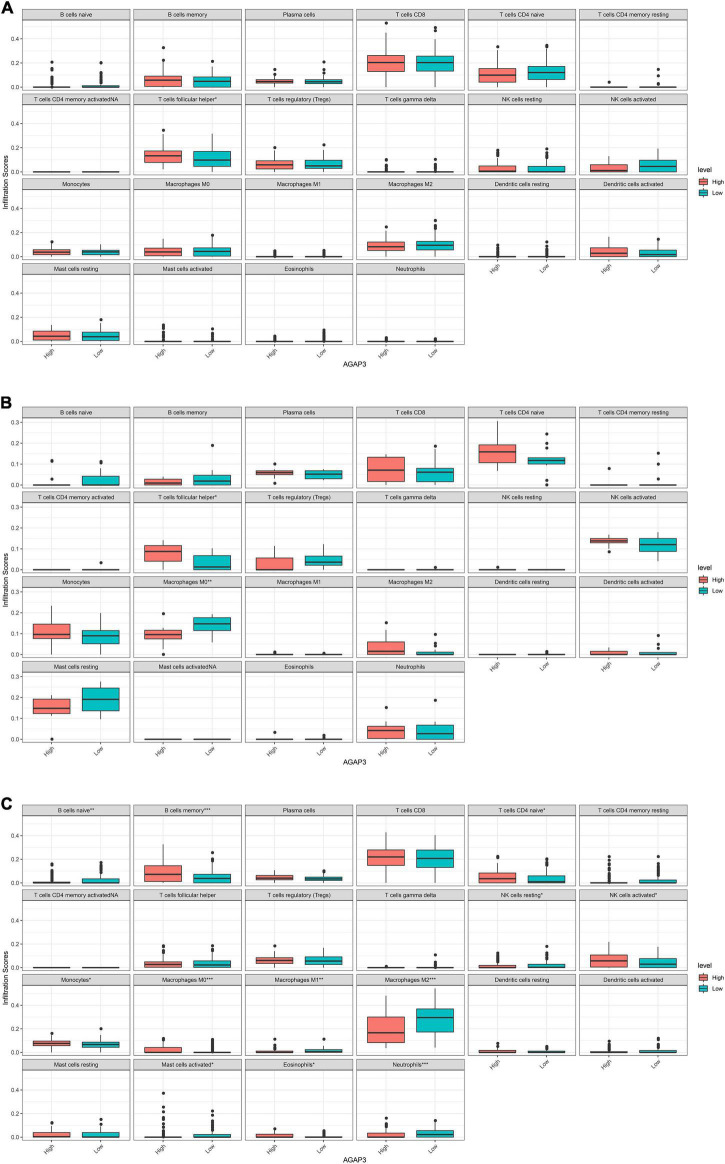
FIGURE 6.
Correlation between diagnostic gene expression and infiltration levels of immune cells in AD. (A) The correlation of between AGAP3 and immune infiltrating cells in GSE5281. (B) The correlation of between AGAP3 and immune infiltrating cells in GSE28146. (C) The correlation of between AGAP3 and immune infiltrating cells in GSE48350. *P < 0.05, **P < 0.01, ***P < 0.001.

