FIGURE 11.

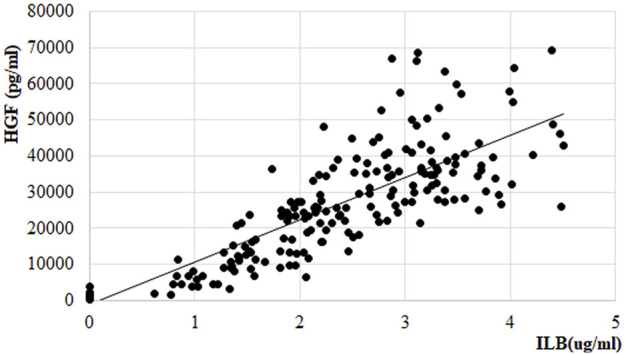
Relationship between HGF and ILB® concentration in plasma of patients with ALS. Linear regression within therapeutic range of ILB®, regression function: y = 11733x-1197.2; R 2 = 0.7014.

Relationship between HGF and ILB® concentration in plasma of patients with ALS. Linear regression within therapeutic range of ILB®, regression function: y = 11733x-1197.2; R 2 = 0.7014.