FIGURE 12.

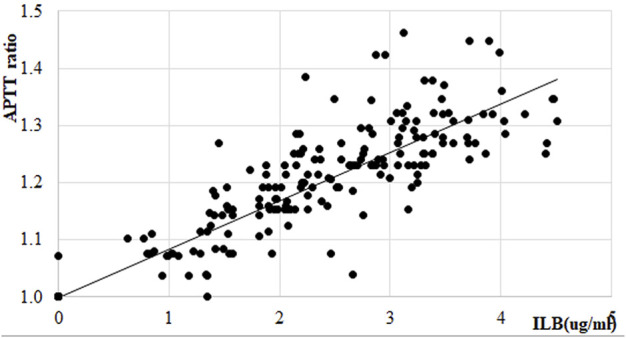
Effect of ILB® on APTT ratio in patients with ALS. Linear regression within therapeutic range of ILB®, regression function: y = 0.0844x+0.9999; R 2 = 0.5202.

Effect of ILB® on APTT ratio in patients with ALS. Linear regression within therapeutic range of ILB®, regression function: y = 0.0844x+0.9999; R 2 = 0.5202.