FIGURE 5.
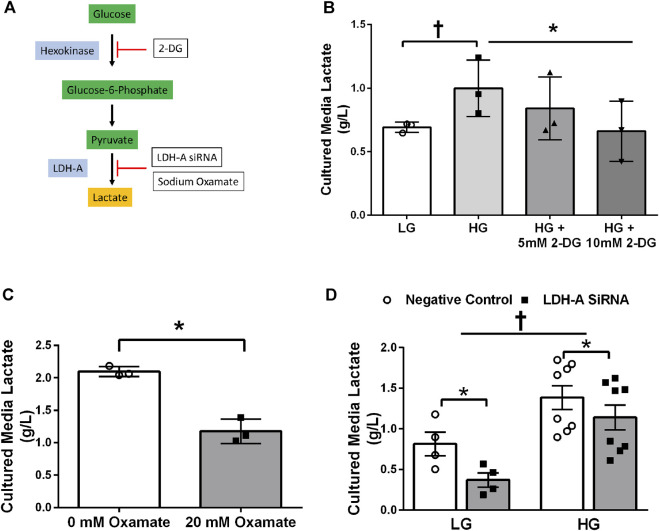
Culture Media Lactate Accumulation in Response to Glycolytic Intervention. Model of pharmacological and siRNA methodology to manipulate lactate accumulation (A). Culture media lactate concentrations in response to 24 h low glucose (LG, 5.6 mmol/L) and high glucose (HG, 20 mmol/L) treatment and in response to 24 h 2-DG treatment (n = 3) (B). Culture media lactate concentrations in response to 24 h sodium oxamate treatment (n = 3) (C). Culture media lactate concentrations in response to negative control (Silencer Select) and LDH siRNA under low glucose (LG, 5.6 mmol/L) and high glucose (HG, 20 mmol/L) treatment (n = 8) (D). Lactate concentrations were presented relative to myotube protein concentrations per well. Data is expressed as mean ± SEM. *p < 0.05 main effect for inhibitory treatment; †p < 0.05 low glucose vs high glucose. Sample size (n) represents biological replicates from HSkMC derived from different individuals.

