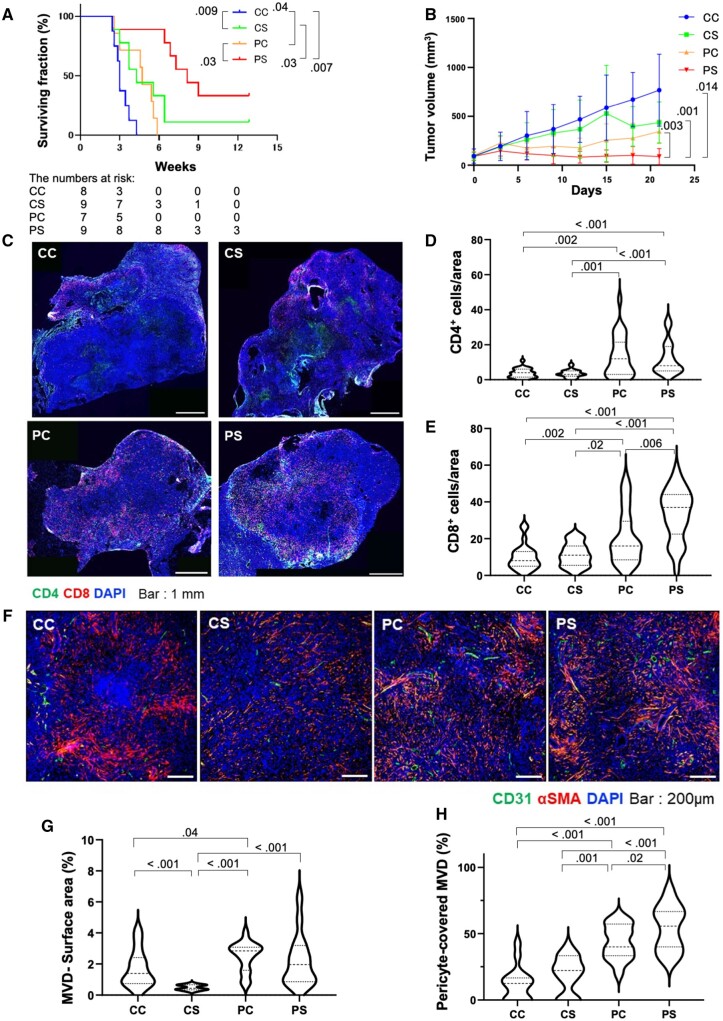
Figure 1.
Changes in overall survival, tumor growth kinetics, and intratumoral lymphocyte infiltration and microvascular density in mice receiving sorafenib treatment after prior anti–PD-1 therapy. A, B) Kaplan-Meier distributions of overall survival (A) and tumor growth kinetics (B) in orthotopic HCC-bearing mice receiving sorafenib after initial anti–PD-1 therapy (PS) compared with IgG control followed by PBS gavage (CC), IgG control followed by sorafenib (CS), and anti–PD-1 therapy followed by PBS gavage (PC) (n = 8-9 mice per group). Tumor volume at day 21 was statistically significantly different in the PS group (88.5 [81.3] mm3 vs 767.5 [368.6] mm3 [CC group, P = .01], 435.7 [212.2] mm3 [CS group, P = .001], and 345.1 [116.5] mm3 [PC group, P = .003]). C) Representative immunofluorescence for CD4+ and CD8+ T cells in tumors tissues from the 4 treatment groups. D, E) The frequencies of tumor-infiltrating CD4+ cells (D) and CD8+ T cells (E), shown as mean [SD] number of cells per field (320 × 320 µm square area). F) Representative immunofluorescence for the endothelial marker CD31 and the pericyte marker α-SMA in tumor tissues from the 4 treatment groups. G, H) Quantification of tumor MVD, shown as area fraction covered by vessels per field (640 × 640 µm square area) (G) and mature (pericyte-covered) MVD (H), shown as fraction of tumor vessels covered by perivascular cells; error bars represent standard deviations. For autochthonous HCC model data, see Supplementary Figure 2, C-H (available online). Scale bars: 1 mm (C) and 200 µm (F). P values from log-rank test (A) and Wilcoxon rank sum test (B, D, E, G, H). All statistical tests were 2-sided. HCC = hepatocellular carcinoma; MVD = microvessel density; SMA = smooth muscle actin.

