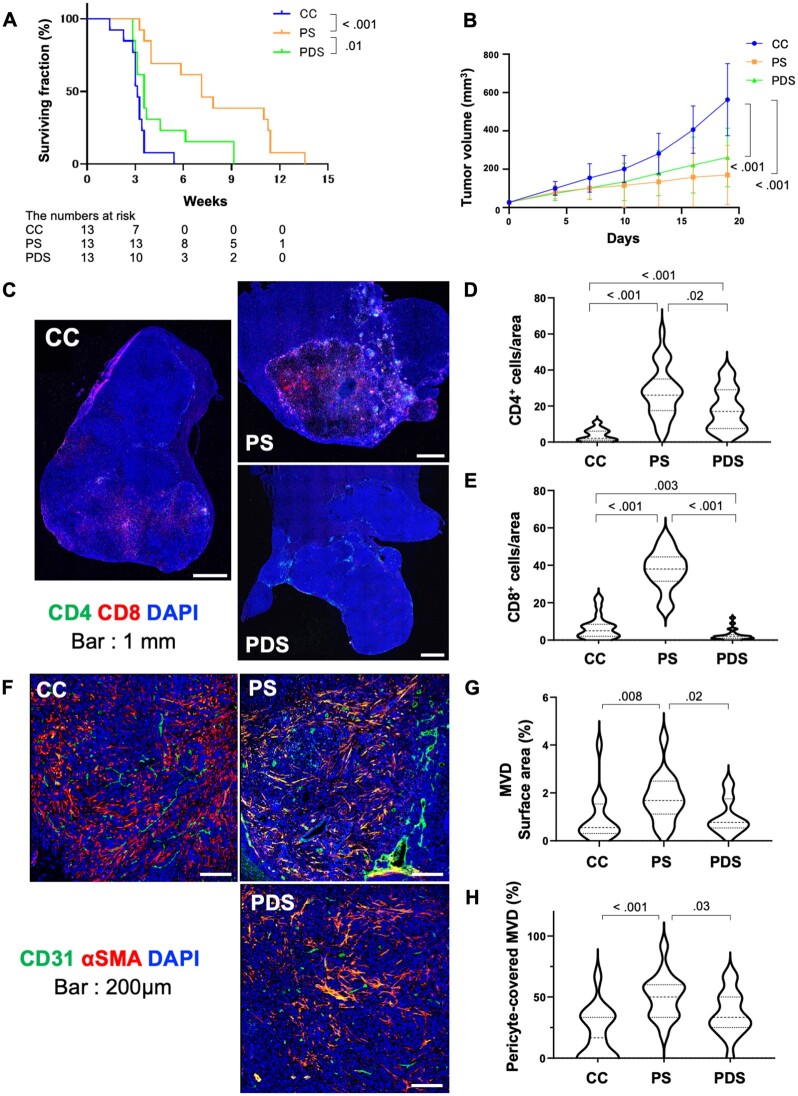
Figure 2.
Impact of CD8+ T-cell infiltration on the survival benefit of sorafenib after anti–PD-1 therapy priming in orthotopic HCC in mice. A, B) Kaplan-Meier survival distributions (A) and tumor growth kinetics (B) in mice receiving sorafenib with anti-CD8 antibody-mediated depletion (PDS) or immunoglobulin control (PS) after initial anti–PD-1 therapy compared with control (C) (n = 13 mice per treatment group). C) Representative immunofluorescence for CD4+ and CD8+ lymphocytes in tumors tissues from the 3 treatment groups at day 13. D, E) The frequencies of intratumoral CD4+ (D) and CD8+ (E), shown as mean [SD] number of cells per field (320 × 320 µm square area). (F) Representative immunofluorescence for the endothelial marker CD31 and the pericyte marker α-SMA in tumor tissues from the 3 treatment groups at day 13. G, H) Quantification of tumor MVD, shown as area fraction covered by vessels per field (640 × 640 µm square area) (G) and mature (pericyte-covered) MVD (H), shown as fraction of tumor vessels covered by perivascular cells. Scale bars: 1 mm (C) and 200 µm (F). Error bars represent standard deviations. P values from log-rank test (A) and Wilcoxon rank sum test (B, D, E, G, H). All statistical tests were 2-sided. HCC = hepatocellular carcinoma; MVD = microvessel density; SMA = smooth muscle actin.

