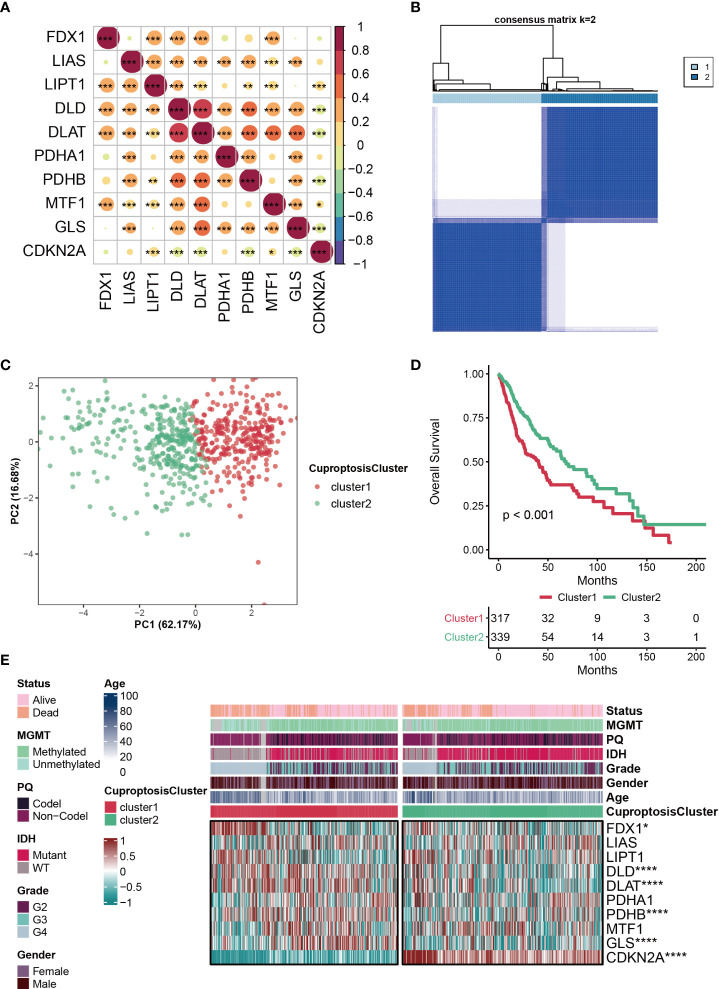
Figure 1.
Characteristics of CuproptosisCluster in TCGA-glioma cohort. (A) The correlations among the ten cuproptosis-related genes (CRGs). The color represents the correlation coefficient. (B) Cluster diagram for subtype analysis of glioma samples. The intragroup correlations were the highest and the inter-group correlations were low when k=2. (C) PCA analysis for the two subclusters. (D) Kaplan-Meier survival curve showing survival probability of cluster1 and cluster2. (E) Heatmap showing the expression levels of the ten cuproptosis-related genes (CRGs) in different clinical features and clusters. *P < 0.05; **P < 0.01; ***P < 0.001; ****P < 0.0001.

