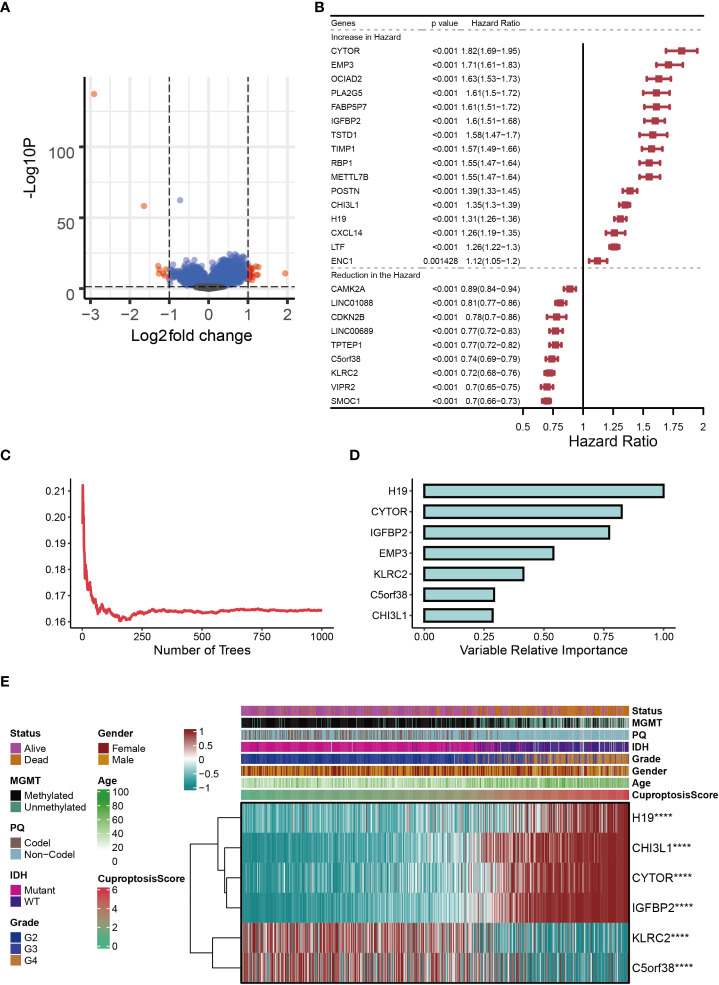
Figure 2.
Establishment of cuproptosis-signature. (A) The volcano map reflects the differentially expressed genes identified (logFC > 1, P < 0.05). (B) The forest figure for Univariate Cox regression analysis of the differentially expressed genes. (C) The distribution of error rates in Random Survival Forest model. (D) The variable relative importance of the seven genes. (E) Heat map showing the relationship between six genes in the cuproptosis-signature and CuproptosisScore distribution and its clinical characteristics. ****P < 0.0001.

