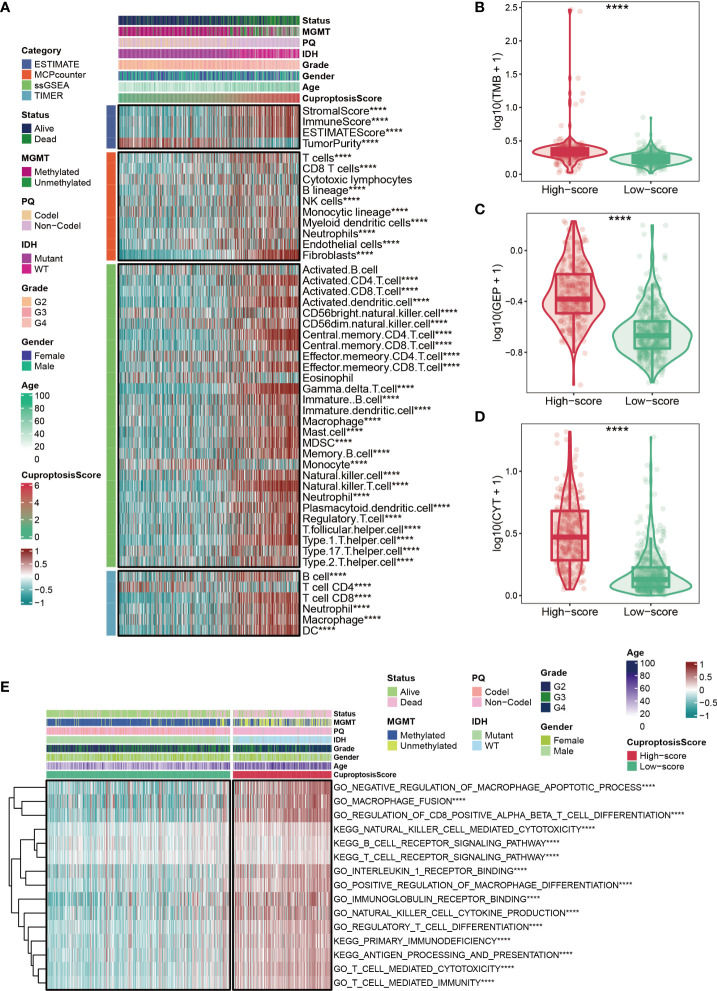
Figure 5.
Immune status for cuproptosis-signature. (A) The heatmap shows the abundance of infiltrating immune cell populations at different CuproptosisScores. (B–D) Glioma patients with high CuproptosisScores had higher levels of TMB (B), GEP (C), and CYT (D). (E) The heatmap shows CuproptosisScores, clinical features, and immune-related pathways based on GSVA analysis. ****P < 0.0001.

