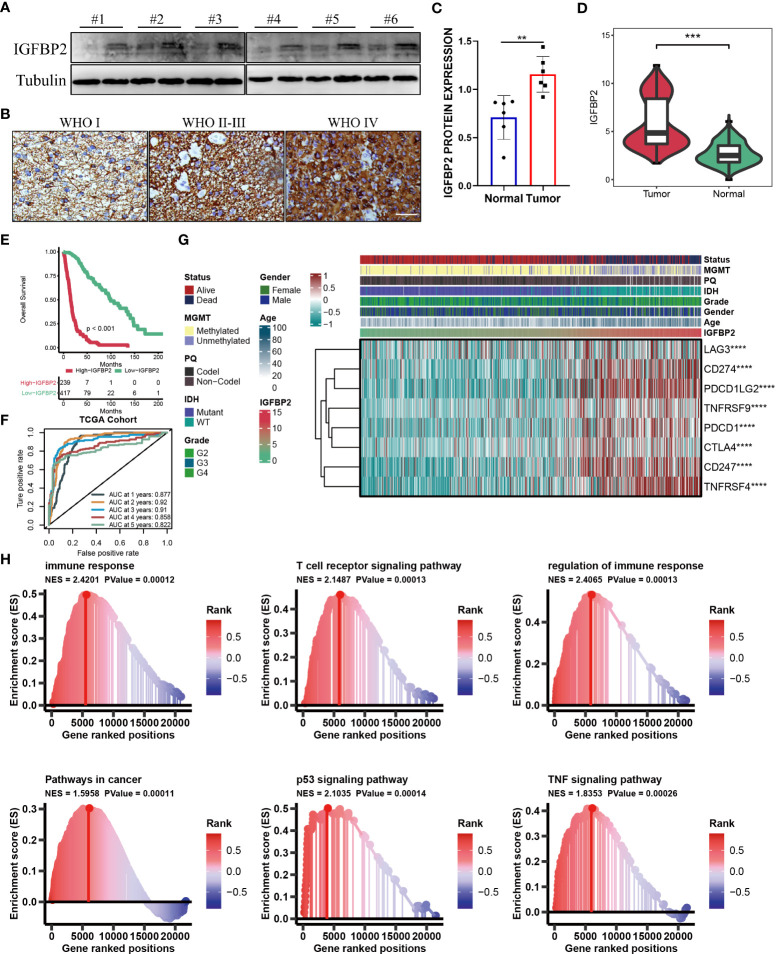
Figure 7.
(A) WB for IGFBP2 in 3 pairs patients from Nantong cohort. (B) Represented IHC for IGFBP2 in three parents with different WHO stage from Nantong cohort. (C) Boxplot of IHC for IGFBP2 in six pairs parents from Nantong cohort. (D) The expression level of IGFBP2 in glioma sample and the control normal sample. (E) Kaplan-Meier survival curve showing survival probability of high- or low-expression IGFBP2. (F) The 1-year, 2-year, 3-year, 4-year, and 5-year survival ROC curves are predicted by the expression of IGFBP2. (G) The heat map shows the correlation between IGFBP2 and eight immune checkpoints in TCGA. (H) GSEA maps of cancer and immune-related signaling pathways positively modulated by IGFBP2. ∗∗P < 0.01; ∗∗∗P < 0.001; ∗∗∗∗P < 0.0001.

