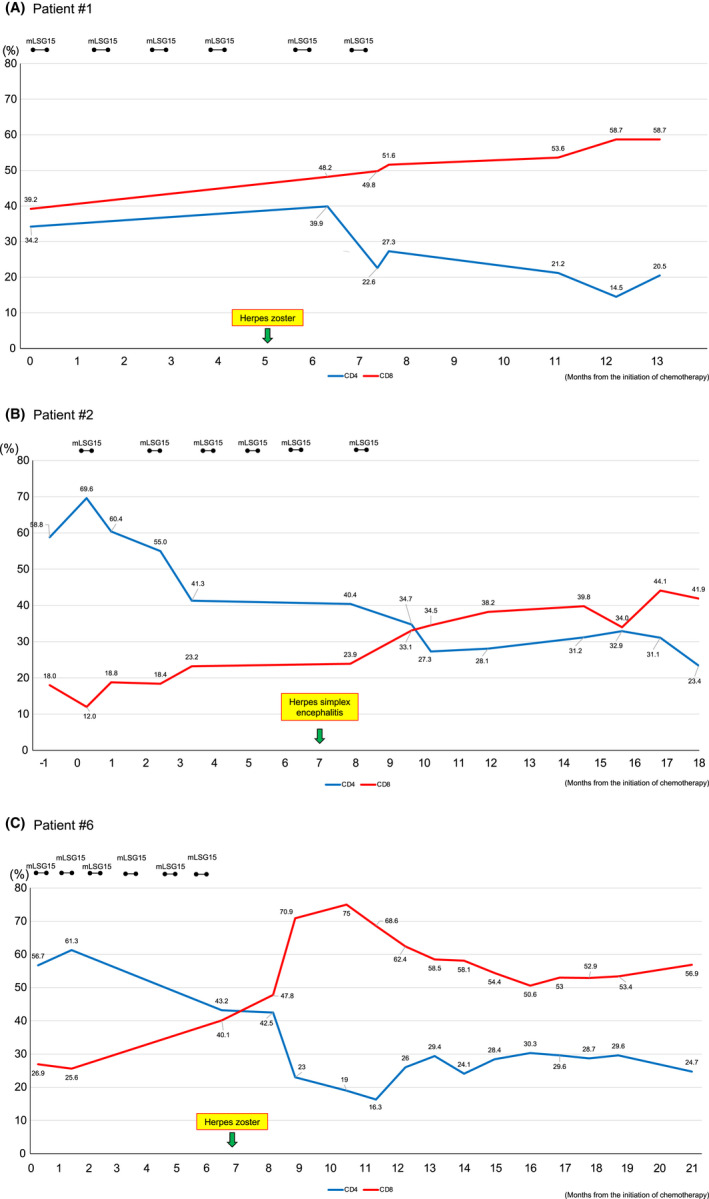
FIGURE 2.

Changes in the levels of CD4‐ and CD8‐positive T‐lymphocytes in three aggressive‐type ATLL patients treated with intensive chemotherapy alone. (A) Patient #1; (B); Patient #2; and (C) Patient #6. The percentages of CD4‐positive (blue lines) and CD8‐positive (red lines) T‐lymphocytes are indicated. Black bars indicate VCAP‐AMP‐VECP (mLSG15) chemotherapy. The occurrences of herpes virus infection are indicated with arrows
