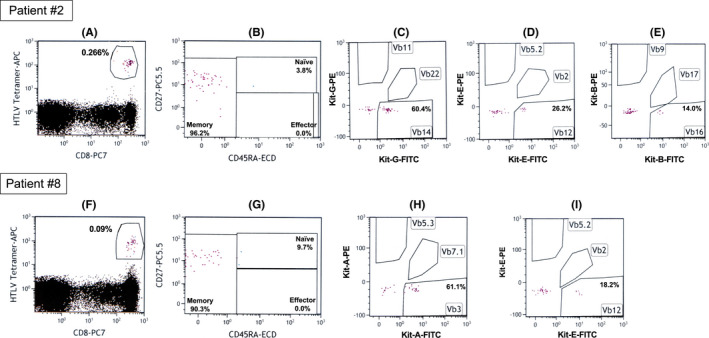
FIGURE 4.

Representative data of HTLV‐1 Tax‐specific CTLs and T‐cell receptor repertoire analysis. The upper panels from (A–E) show the data on Patient #2, whereas the lower panels from (F–I) show the data on Patient #8. CD8‐positive and HTLV‐1 Tax‐specific tetramer‐positive T‐lymphocytes surrounded by the circles indicate HTLV‐1 Tax‐specific CTLs in panels (A and F). HTLV‐1 Tax‐specific memory, effector, and naïve CTLs are shown in panels (B and G). Selected T‐cell receptor Vβ gene repertoire in HTLV‐1 Tax‐specific CTLs are shown in panels (C, D, E, H, and I). Peripheral blood mononuclear cells were directly analyzed by flow cytometry without any stimulation using the HTLV‐1 Tax‐specific tetramers (BML) and the Beta Mark TCR Vβ repertoire kit (Beckman Coulter) as specified by the manufacturer
