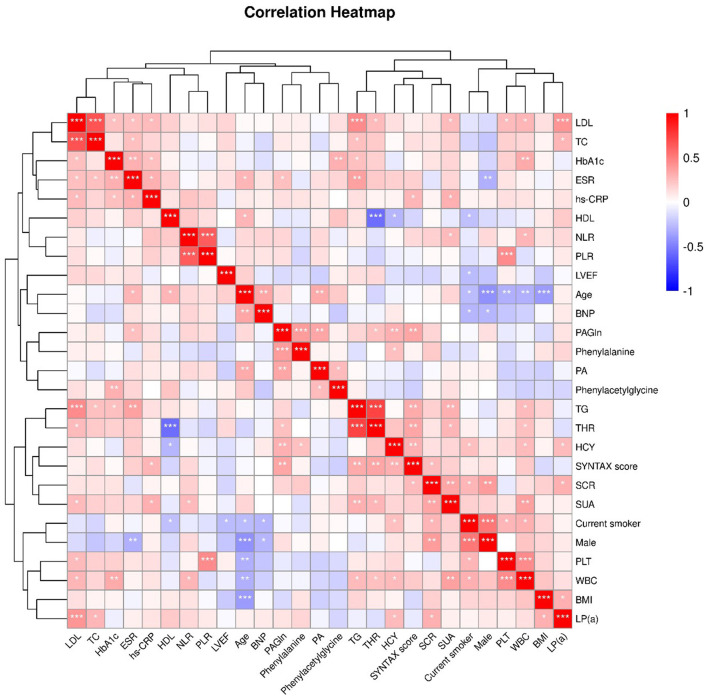
Figure 2.
Heatmap showing the correlation between clinical characteristics. The correlation coefficient (Spearman's correlation analysis) is expressed in different colors, Red, positive correlation, Blue, negative correlation. *, P <0.05; **, P < 0.01; ***, P < 0.001. LDL, low-density lipoprotein cholesterol; TC, total cholesterol; HbA1c, glycosylated hemoglobin, type A1C; ESR, erythrocyte sedimentation rate; hs-CRP, high-sensitivity C-reactive protein; HDL, high- density lipoprotein cholesterol; NLR, neutrophil-lymphocyte ratio; PLR, platelet- lymphocyte ratio; LVEF, Left ventricular ejection fraction; BNP, B-type natriuretic peptide;PAGln, phenylacetylglutamine; PA, phenylacetic acid; TG, triglyceride; THR, TG-HDL ratio; HCY, homocysteine; SCR, serum creatinine; SUA, serum uric acid; PLT, platelet; WBC, white blood cell; BMI, body mass Index; LP(a), lipoprotein(a).

