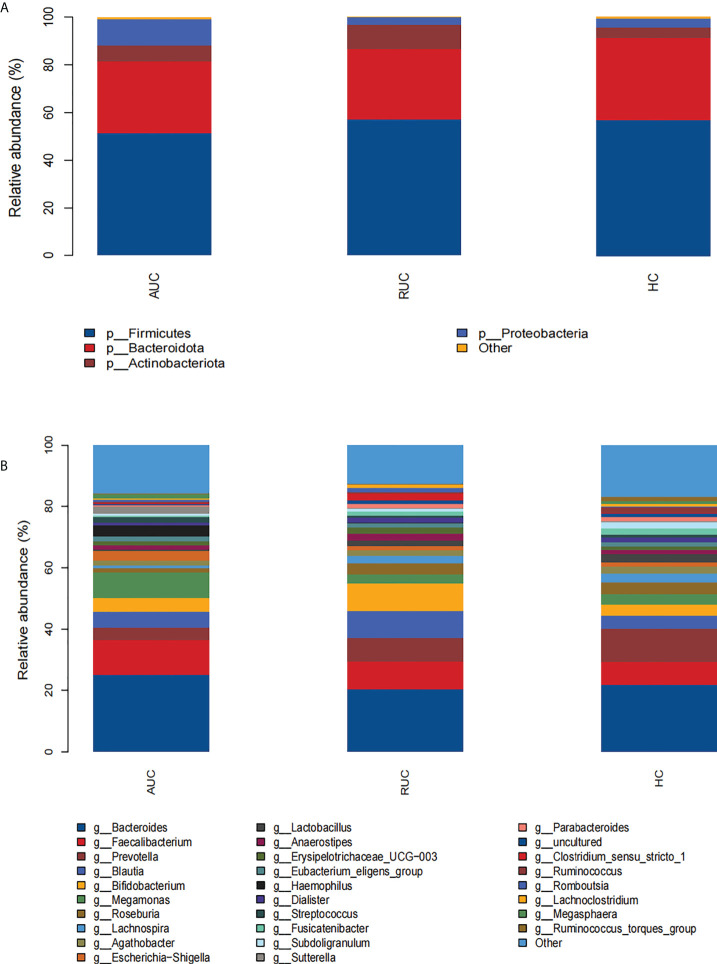
Figure 2.
The microbiological compositions at the phylum and genus levels. The stacked bars show the average relative abundances of all phyla and the most common genera and species identified in the three groups. The histograms show species distribution at the phylum (A) and genus (B) levels in the three groups. AUC, UC patients with active disease; RUC, UC patients in remission; and HC, healthy control subjects.

