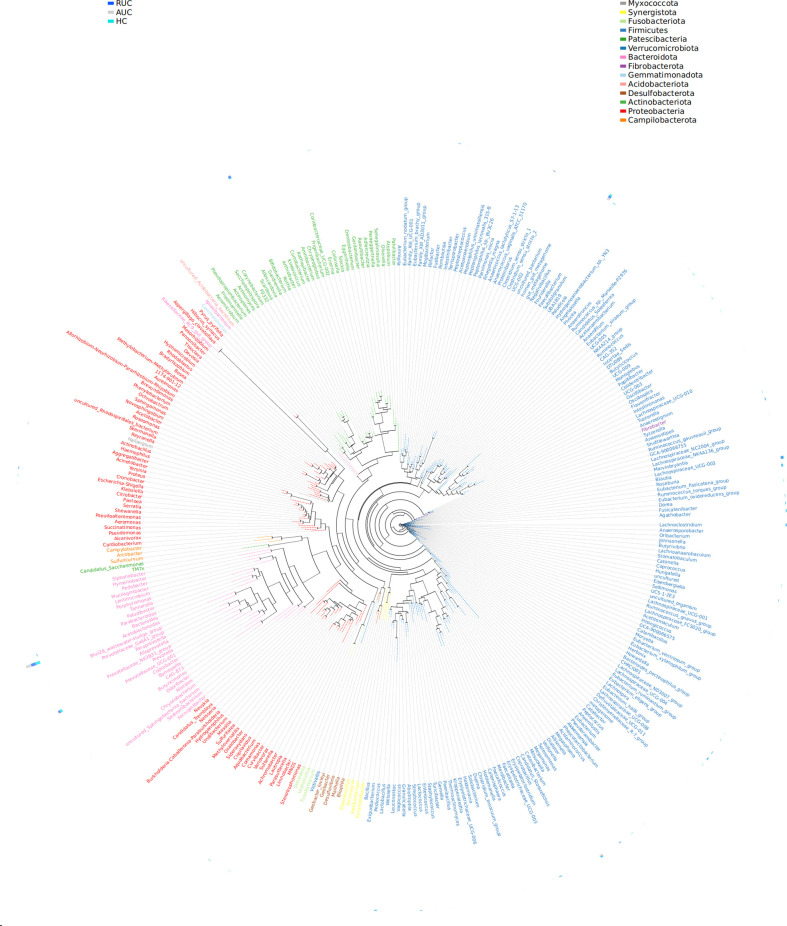
Figure 5.
Genus-level evolutionary tree. The first column is the grouping information, and the second column is the phylum level corresponding to the genus level. The representative sequences corresponding to the most abundant OTUs were selected by genus as a unit to build the dendrogram, and the outer circle of the evolutionary tree shows the relative abundance of each genus in each of the different groups. The length of the color blocks represents the relative abundance. AUC, UC patients with active disease; RUC, UC patients in remission; and HC, healthy control subjects.

