
FIGURE 2.
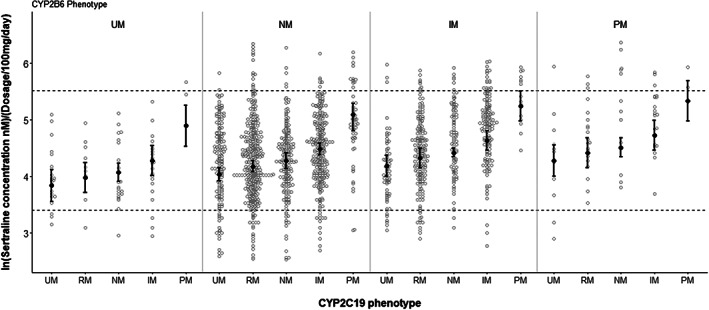
Sertraline serum concentration measurements in different phenotype subgroups of CYP2C19 and CYP2B6. The sertraline serum concentrations were normalized to the dosage of 100 mg/day and analyzed in the natural logarithmic scale. Predicted serum concentration is based on mixed‐model analyses of the different CYP2C19 and CYP2B6 phenotype subgroups and is presented as error bars for each phenotype combination. The dotted line indicates the therapeutic reference range (30–250 nM)