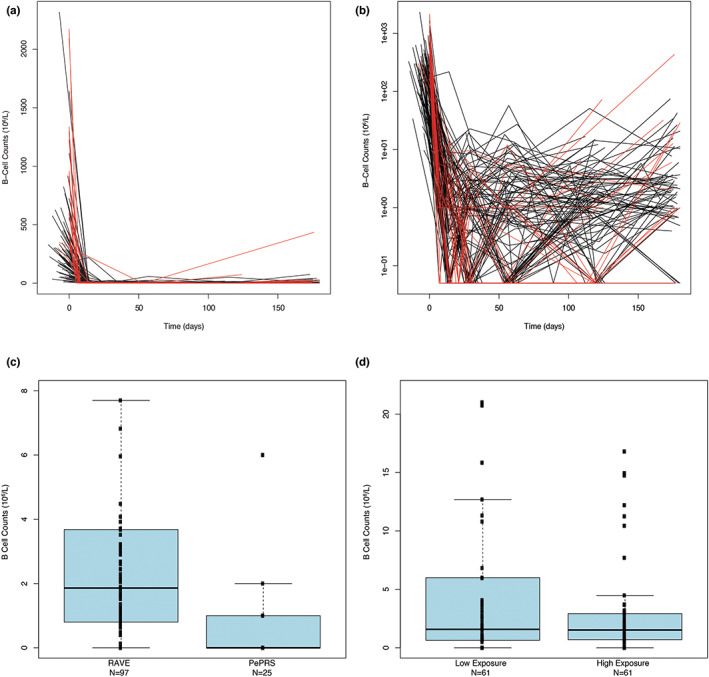
FIGURE 2.

Observed CD19 B‐cell levels over time in adult and pediatric patients in the induction setting. (a) For the two studies superimposed. (b) For the two studies superimposed (zoomed). Red lines: B‐cell counts over time for pediatric patients; Black lines: B‐cell counts over time for adult patients. B‐cell counts equal to zero were assigned a value of 0.05 on the semi‐log scale plots. (c) Distributions of B‐cell count at 180 days by study (zoom through data). (d) Distributions of B‐cell count at baseline and at 180 days by exposure category for the two studies combined. The B‐cell counts are plotted versus an exposure category using a box and whisker plot. Median values of the B‐cells are designated by black lines in the center of the boxes. Boxes indicate IQR. Whiskers represent 1.5*IQR. Outliers are marked outside of the whiskers by circles. Exposure categories were defined by the values of AUC180. Low and high exposure categories included 61 patients each with AUC180 less or equal (greater) than the median of AUC180 values in patients of the combined set of RAVE and PePRS (equal to 10,201 μg*day/ml). One patient with a B‐cell count greater than 400 106/L was excluded for better figure visibility. AUC, area under the curve; IQR, interquartile range.
