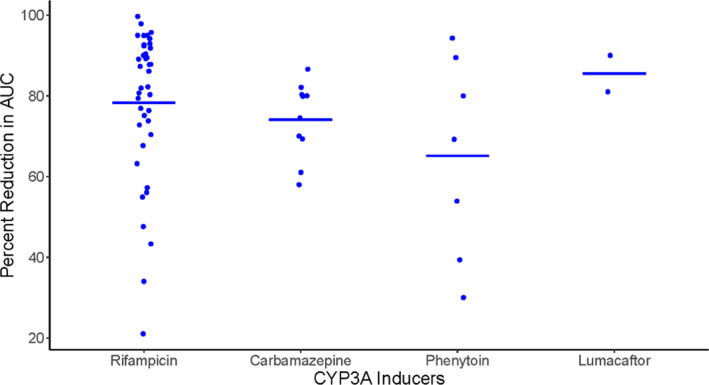
FIGURE 4.

Comparison of percent decrease in AUC of sensitive CYP3A substrates (Y‐axis) upon coadministration of rifampicin and strong CYP3A inducers that are proposed as an alternative to rifampicin (X‐axis). The percent AUC reduction data for sensitive CYP3A substrates upon co‐administration of rifampicin (oral, 600 mg daily dose, 5–36 days) was obtained from the University of Washington DDI database. Doses and schedules for alternative strong CYP3A inducers are presented in Table 2. Lumacaftor data represents only two available (ivacaftor and itraconazole [not a sensitive substrate of CYP3A]) CYP3A induction studies. If more than one study was reported for the same substrate, the weighted mean across studies was calculated to represent one data point for each substrate. The horizontal line represents the mean of percent AUC reduction across all reported sensitive CYP3A substrates). AUC, area under the curve; DDI, drug‐drug interaction.
