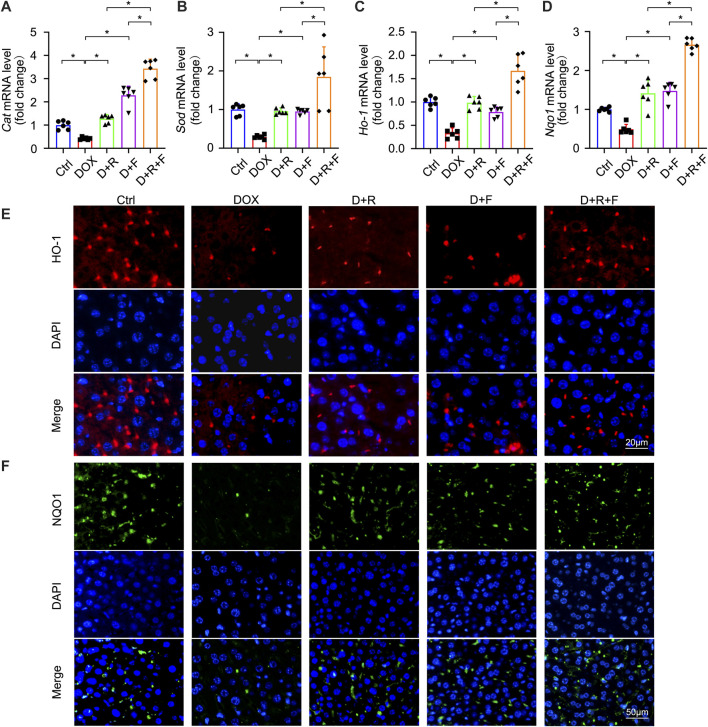
FIGURE 3.
Expression of NRF2 downstream antioxidant factors CAT, SOD, HO-1, and NQO1 was elevated after RES and FGF1 co-treatment in mice. (A-D) Relative mRNA expression levels of Cat, Sod, Ho-1 and Nqo1 after the indicated treatments (n = 6). (E,F) Representative fluorescence microscopy images of IF staining for HO-1 (Red) and NQO1 (Green) in liver tissues. Data are expressed as mean ± SD. *p < 0.05.

