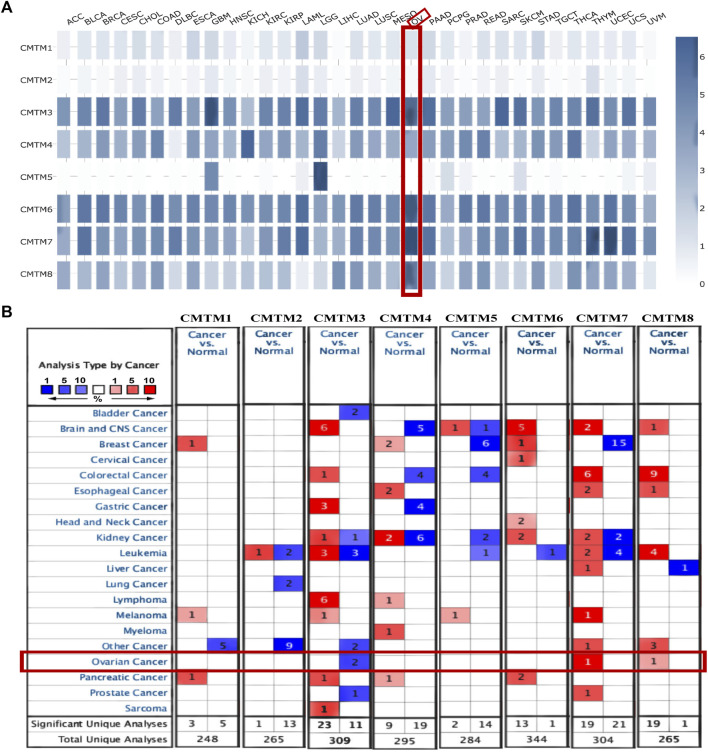
FIGURE 1.
Transcriptional expression of CMTM family gene in pan-cancer. (A) The expression of CMTMs in different types of tumor tissues in the GEPIA database. The shade of the blue square represents the level of gene expression. The darker the blue, the higher the gene expression level. Ovarian cancer was specifically selected with a red line frame. The expression level of CMTM3/4/6/7/8 was relatively high in ovarian cancer. (B) The mRNA levels of each member of the CMTM family in different types of cancer and the number of related studies based on the ONCOMINE database. A red square represents a relatively high expression of the gene in a relevant study, a blue square represents a relatively low expression of the gene in a relevant study, and the number in the square represents the number of relevant studies. For example, in breast cancer, there are 15 relevant studies all showing a meaningful relative expression of CMTM7. Statistical significance parameters: p < 0.01, fold change >1.5, gene class significance threshold: 10%, data type: mRNA.

