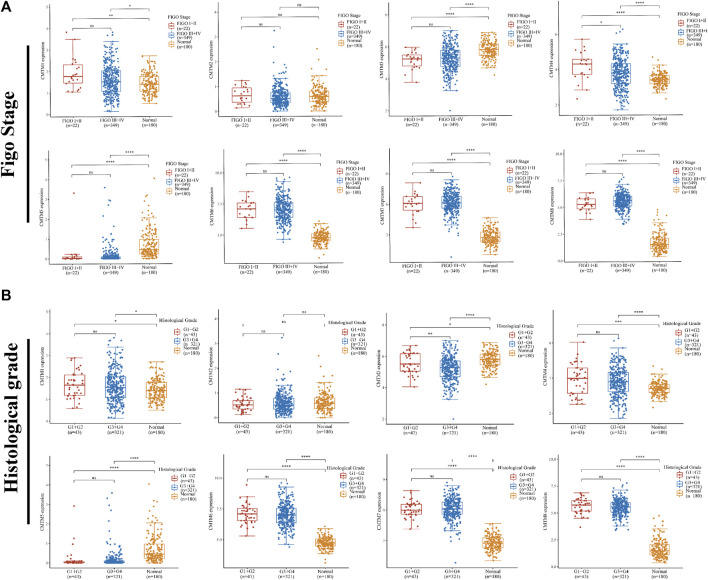
FIGURE 4.
The relationship between the expression levels of each member of the CMTM family and different clinical characteristics. (A) Differences in mRNA expression levels of CMTMs in different FIGO stages (I + II = 22, III + IV = 349, normal = 180). (B) Differences in mRNA expression levels of CMTMs of different histological grades (G1+G2 = 43, G3+G4 = 321, normal = 180). *p < 0.05; **p < 0.01; ***p < 0.001.

