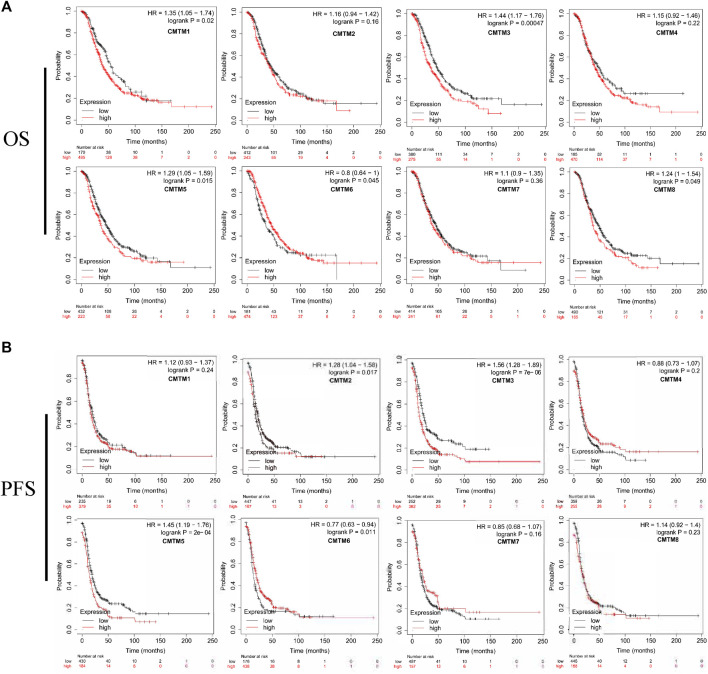
FIGURE 5.
Survival analysis of ovarian cancer patients with high and low mRNA expression levels of different CMTM family members. (A) The survival curve of the overall survival time of the high gene expression group and the low gene expression group. (B) The survival curve of the progression-free survival of the high gene expression group and the low gene expression group. The logrank p value, HR (hazard ratio), and 95% confidence interval were recorded. p value of <0.05 was considered statistically significant.

