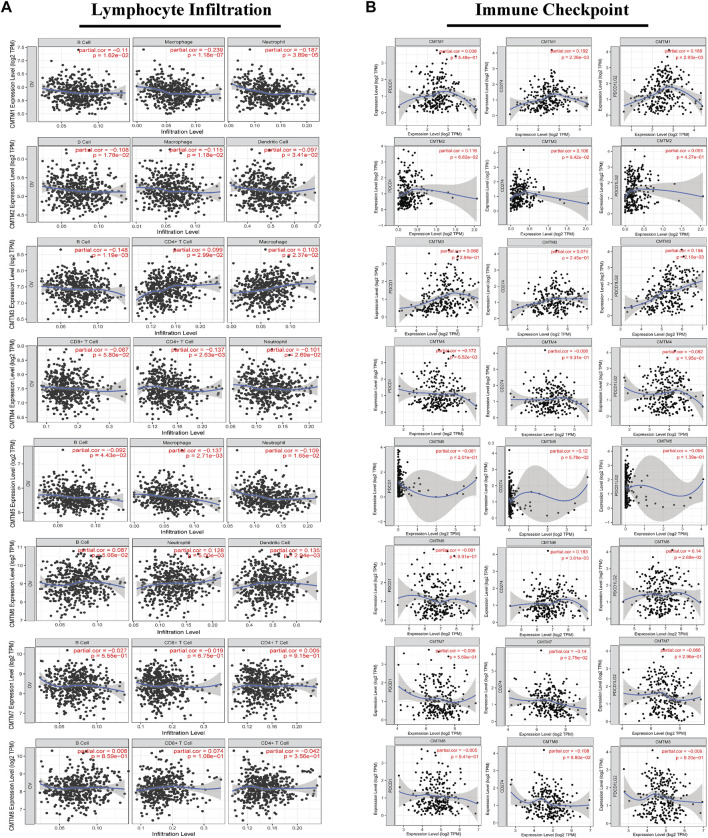
FIGURE 8.
The correlation between the expression level of each member of the CMTM family and the degree of immune infiltration of multiple immune cells or the expression of immune checkpoint genes in ovarian cancer tissues. (A) The correlation between the expression level of each member of the CMTM family in ovarian cancer tissues and the degree of immune infiltration of a variety of immune cells, including B cells, CD8+T cells, CD4+T cells, macrophages, neutrophils, and dendritic cells. (B) The correlation between the expression level of CMTM and the genes PDCD1, CD274, and PDCD1LG2 that encode the immune checkpoints of PD1, PDL1, and PDL2. Spearman’s method was used for correlation analysis. Partial. cor >0 was considered a positive correlation. Partial. cor <0 was considered a negative correlation. p < 0.05 was considered statistically significant.

