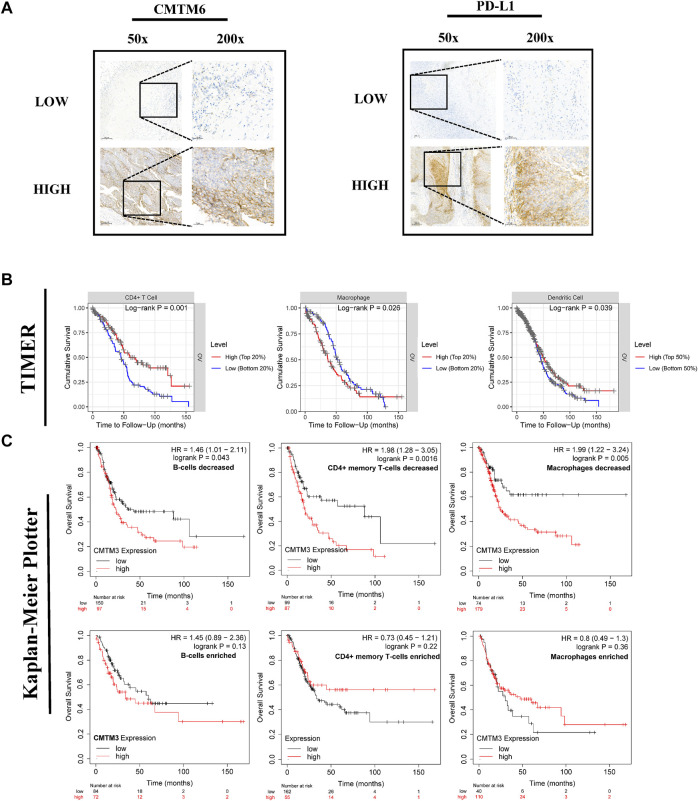
FIGURE 9.
The immunohistochemical images of CD274 (PD-L1) and CMTM6, including 50x and 200x, respectively. The effect of CMTM3 expression level under different immune cell infiltration or different immune cell infiltration on the prognosis of patients with ovarian cancer. (A) The immunohistochemical images of CD274 (PD-L1) and CMTM6, including 50x and 200x, respectively. (HIGH represents the high-expression group of the CMTM6 gene; LOW represents the low-expression group of the CMTM gene) (B) Survival curves of different levels of immune cell infiltration, including dendritic cells, CD4+ cells, and macrophages. (C) Survival curves of the expression level of CMTM3 under different immune cell infiltrations, including B cells, CD4+ cells, and macrophages. The logrank p value, HR (hazard ratio), and 95% confidence interval were recorded. p value of <0.05 was considered statistically significant.

