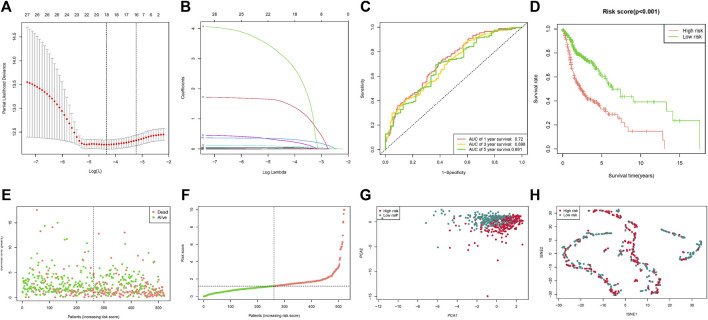
FIGURE 2.
Risk score based on fatty acid metabolism-related microRNAs. (A) LASSO analysis with 10-fold cross-validation identified fatty acid metabolism-related microRNAs. (B) Coefficient profile plots of fatty acid metabolism-related microRNAs. (C) The ROC curves of the low-risk and high-risk groups of the risk score. (D) Survival curves of the low-risk and high-risk groups of the risk score. (E) Risk score of the HNSCC patients. (F) Survival comparison of the low-risk and high-risk groups in HNSCC patients. (G) PCA plot of the low-risk and high-risk groups. (H) t-SNE plot of the low-risk and the high-risk groups.

