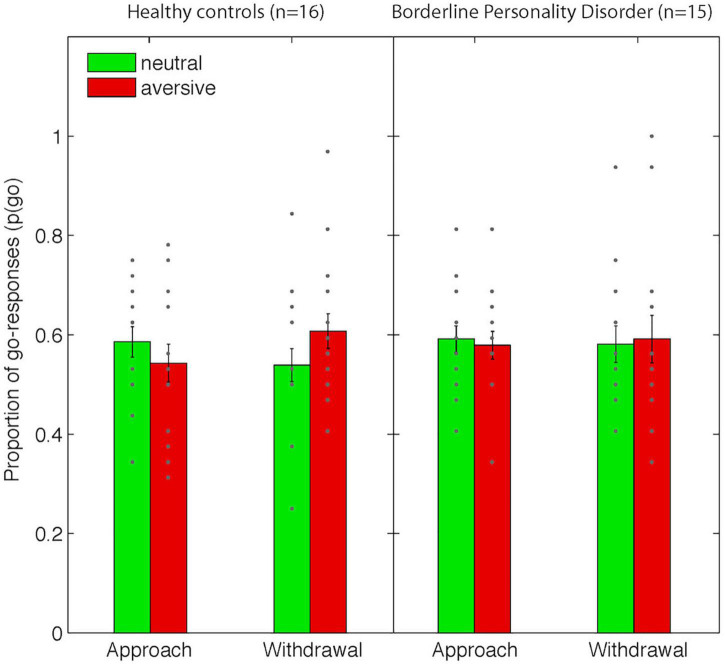
FIGURE 3.
Behavioral data from the Pavlovian-instrumental transfer stage. Shown are mean proportions of go-responses [p(go)] as a function of Action Context (approach vs. withdrawal) and Valence (neutral/aversive). Error bars represent standard errors of the means and dots represent individual data points. Note that there were no significant differences between groups.

