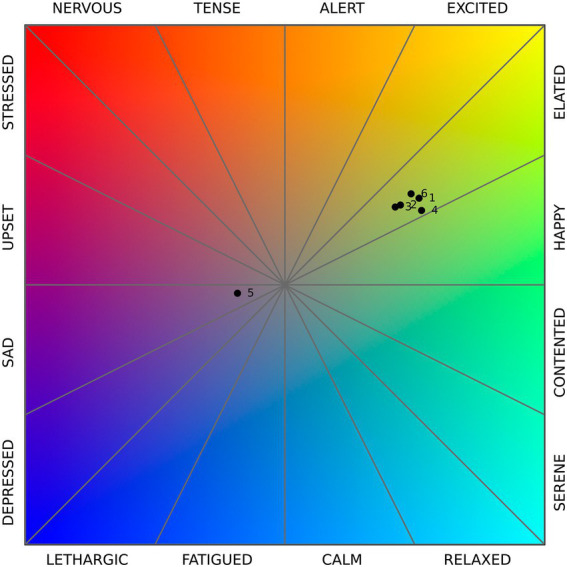
Figure 7.

Mean values of pleasure (x-axis) and arousal (y-axis) for each cluster, positioned on the Cartesian plane described by the circumplex model: POV 1 – the bench on the path, clusters 3, 5, and 6; POV 2 – the bench between the flowerbeds, clusters 2 and 4; POV 3 – pergola, cluster 1. Source: chart based on Russell’s circumplex model, elaboration by the authors.
