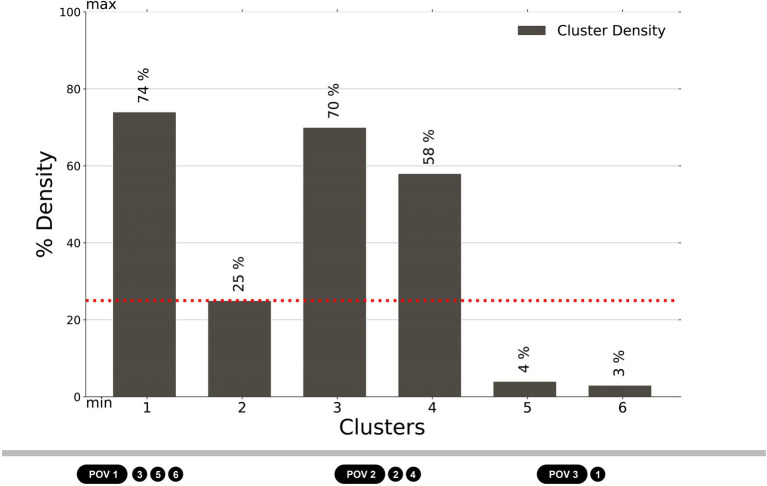
Figure 9.
The cluster density, showing the percentage of respondents who were included in each cluster according to their visual exploration behavior: POV 1 – the bench on the path, clusters 3, 5, and 6; POV 2 – the bench between the flowerbeds, clusters 2 and 4; POV 3 – pergola, cluster 1. The most numerous clusters are homogenously distributed across the three POVs (POV 1 – the bench on the path, cluster 3; POV 2 – the bench between the flowerbeds, cluster 4; POV 3 – pergola, cluster 1).

