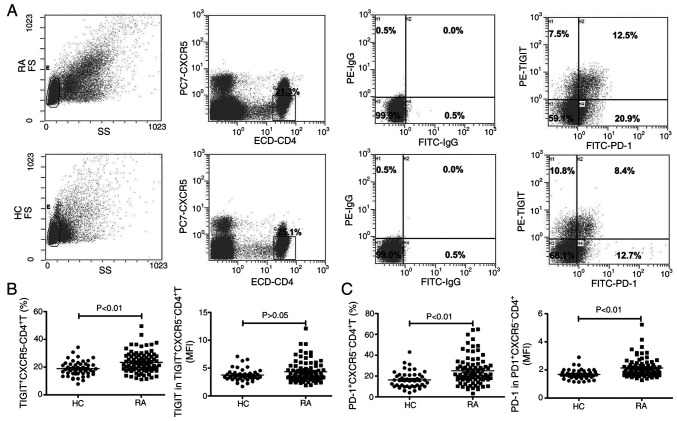
Figure 1.
TIGIT and PD-1 expression in CXCR5- CD4+ T cells in patients with RA and the HC. (A) Representative dot plots of population gating. (B) Percentage of TIGIT+CXCR5-CD4+T cells and the MFI of TIGIT in CXCR5- CD4+ T cells between patients with RA and the HC. (C) Percentage of PD-1+ CXCR5- CD4+ T cells and the MFI of PD-1 in CXCR5- CD4+ T cells between patients with RA and the HC. HC, healthy controls; MFI, mean fluorescence intensity; PD-1, programmed cell death protein 1; RA, rheumatoid arthritis; TIGIT, T cell immunoreceptor with immunoglobulin and ITIM domain; SS, side scatter; PE, phycoerythrin; ECD, PE-Texas red.

