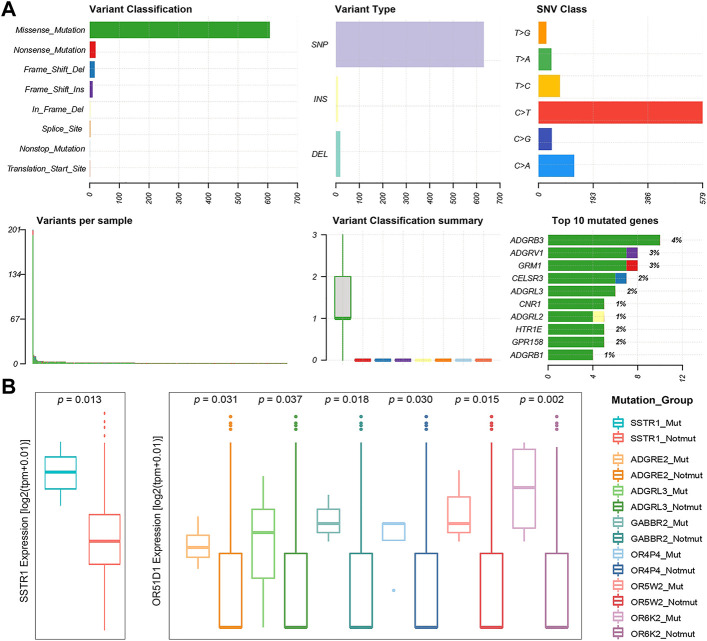
FIGURE 2.
Statistics of GPCR Mutations. (A) A landscape of the GPCRs mutated in 276 primary prostate tumor samples generated by Maftools visualization module. (B) Boxplots of the expression levels of SSTR1 (left) between the SSTR1 mutated and unmutated groups, and OR51D1 (right), an example of a gene that is dysregulated between the mutated and unmutated tumor samples of the other GPCR.

