FIGURE 3.
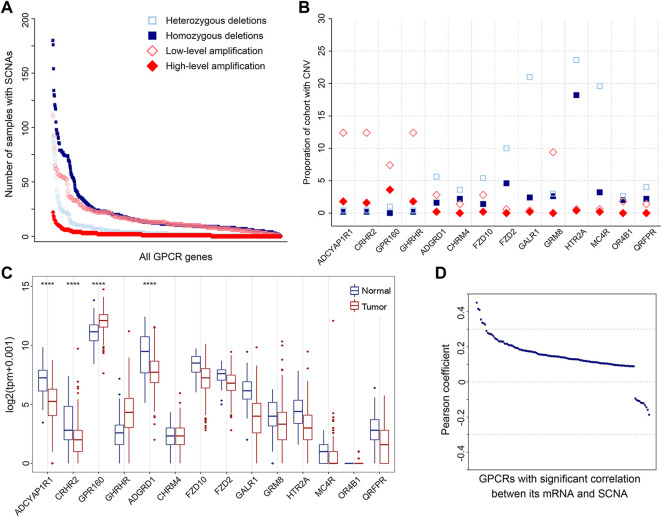
SCNAs of GPCRs in PRAD. (A) The number of heterozygous/homozygous deletions, and low-/high-level amplifications for all GPCRs. (B) Scatter plot of recurrent amplifications and deletions in 500 primary prostate tumor samples. (C) Box plots showing the expression of the significantly deleted and amplified GPCRs between the tumor and normal samples. (D) Distribution of Pearson’s correlation coefficients between the GPCR expression and its linear SCNA values.

