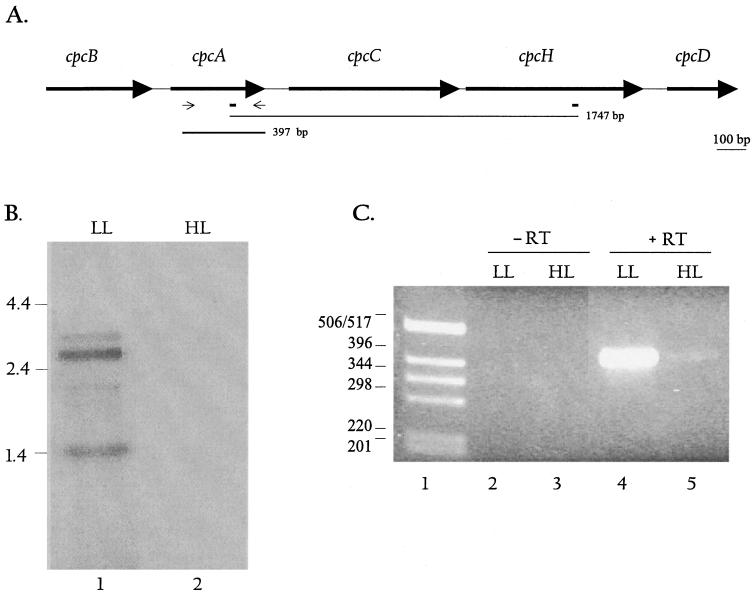
FIG. 4.
Map and expression of the cpcBACHD operon. (A) The map of the cpcBACHD operon shows the relative positions and sizes of the five cpc genes. The positions of the W2-HIPG-like elements are shown as rectangles below the map. The thin line below the map depicts the position and size of the differentially displayed product, while the thick line shows the size and position of the cpcA gene-specific probe. Thin arrows indicate positions of primers used to generate the cpcA-specific probe. (B) Northern blot hybridization using the cpcA-specific probe. Each lane contained 5 μg of RNA. Lanes 1 and 2 show signals from RNA isolated from LL- and HL-grown cells, respectively, hybridized to the cpcA probe. The major transcripts in lane 1 are 3.5, 2.6, 2.0, and 1.4 kb. RNA size markers are given on the left. (C) RT-PCR was performed with RNA from LL- and HL-grown cells using cpcA-specific primers; 100 ng of RNA was used for the reaction, as described in Materials and Methods. Lanes 2 and 3 show the no-RT control; Lanes 4 and 5 show the RT-PCR product (397 bp) generated from LL- and HL-grown cells, respectively.

