
Figure 2.
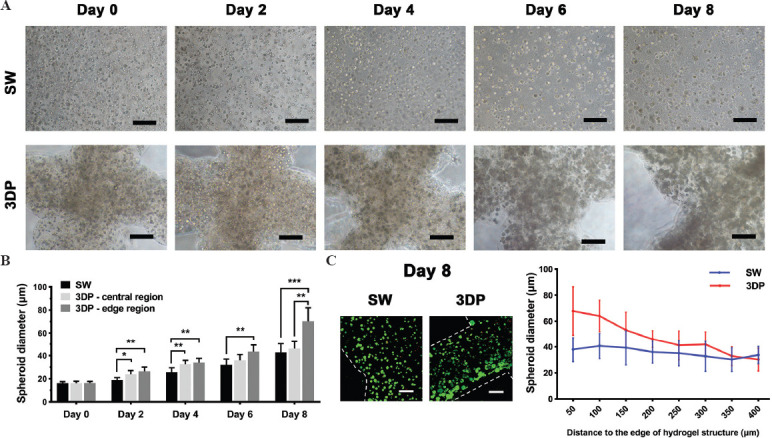
Formation of hiPSC-Heps spheroids in the SW and the 3DP hepatic tissue model. (A) Cellular morphology of hiPSC-Heps during 8 days of culture. (B) The average diameter of hiPSC-Heps spheroids in the SW and 3DP model. Central region: region more than 200 μm from the hydrogel edges; edge region: region within 200 μm of the hydrogel edges. (C) Variation of spheroid diameter in different regions of hydrogel structure on day 8. In the 3DP model, spheroid diameter rapidly decreased as the distance to the edge of hydrogel structure increased (Scale bar: 200 μm). Data are presented as means ± SD (n = 3). *P < 0.05, **P < 0.01.