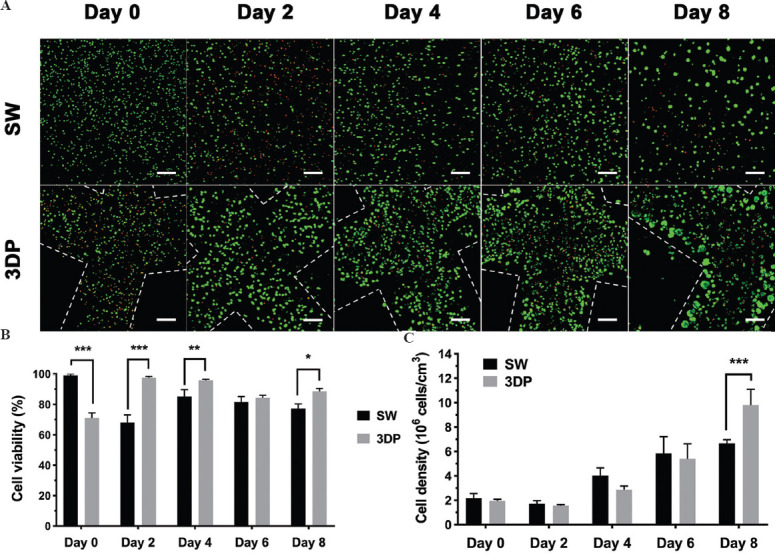
Figure 3.

Cell viability and proliferation in the SW and the 3DP hepatic tissue model. (A) Images of live/dead double-staining during 8 days of culture. (B) Statistics of cell viability rate. (C) Statistics of cell density using CCK8 assay (Scale bar: 200 μm). Data are presented as means ± SD (n = 3). *P < 0.05, **P < 0.01, ***P < 0.001.
