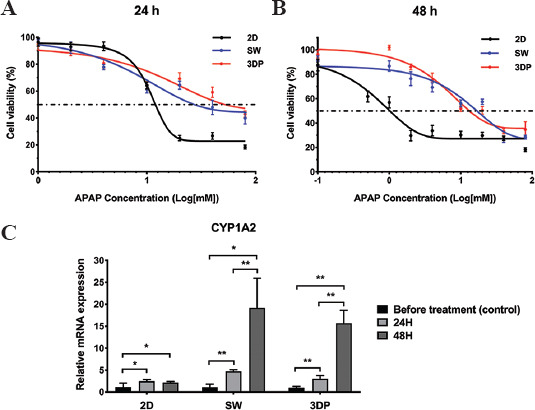
Figure 6.

APAP-induced hepatotoxicity of the hepatic tissue models. (A) Dose-response curves after 24 h treatment of APAP. (B) Dose-response curves after 48 h of treatment with APAP. (C) Expression of cytochrome CYP1A2 measured at the 2 time points under the APAP exposure of IC50 concentrations. Data are presented as means ± SD (n = 3). *P < 0.05, **P < 0.01.
