
Figure 1.
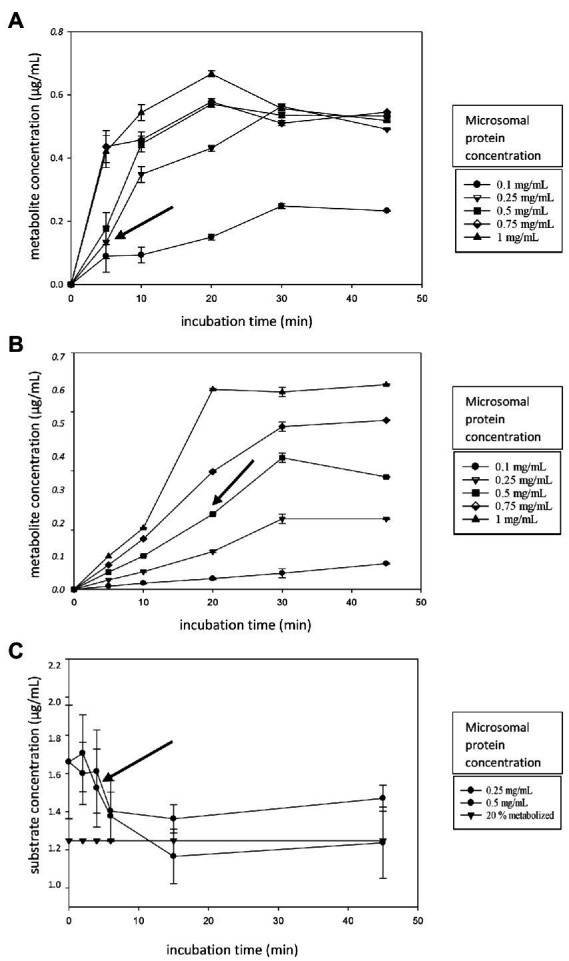
(A–C) Linearity experiment figures. (A) The metabolite formation of alpha-hydroxy-midazolam (α-OH-MDZ, A) and acetaminophen (B) over time (0–45 min) for different microsomal protein concentrations (0.10–1.0 mg/ml). (C) The AFB1 depletion over time (0–45 min) for different microsomal protein concentrations (0.25–0.50 mg/ml). The horizontal curve (black triangles) represents the 20% metabolite formation threshold. Incubations were performed in triplicate, error bars are displayed. The black arrow indicates the chosen microsomal protein concentration and incubation time.