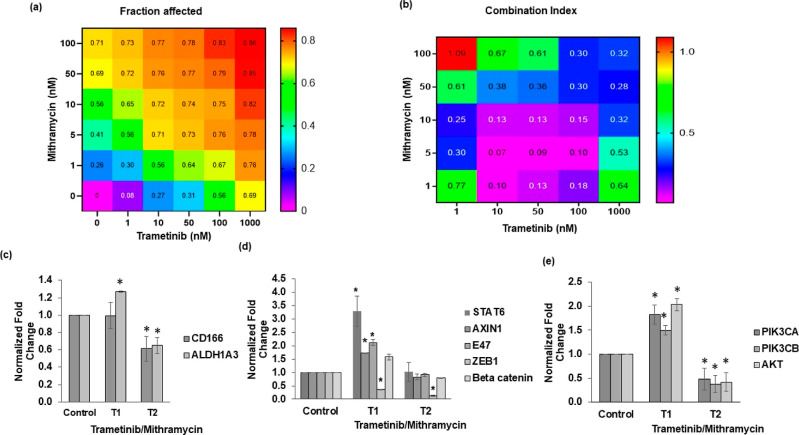
Figure 6.
Therapeutic targeting of CSCs in colorectal tumor spheroids. Heatmap plots in (a,b) represent fraction of cells affected (Fa) by single-agent and combination treatments (trametinib and mithramycin) and the respective combination index values corresponding to the combined concentrations of the two compounds. (c) Gene expression analysis of HCT116 tumor spheroids following cyclic treatments with trametinib/mithramycin combination for (c) CSC genes, (d) STAT pathway (Stat6), Wnt pathway (axin1 and β-catenin), EMT (E47 and Zeb1), and (e) PI3K/Akt pathway. All fold change values are relative to nontreated tumor samples. * denotes p < 0.05 compared to nontreated spheroids. Error bars represent standard errors from the mean (n = 2 independent experiments, two replicates/experiment).

