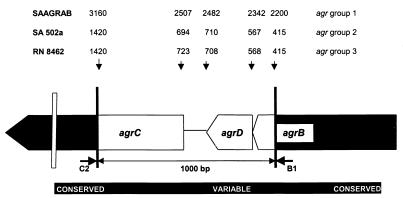
FIG. 1.
Schematic map of the S. aureus agr locus showing the amplified region. The amplicon contained the variable sequence, defining the distinct agr groups (4). Primers C2 and B1 were selected from the conserved sequences. The GenBank nucleotide position numbers of the three agr sequences from the control strains, representing the three agr groups, are indicated above the corresponding positions on the map.

