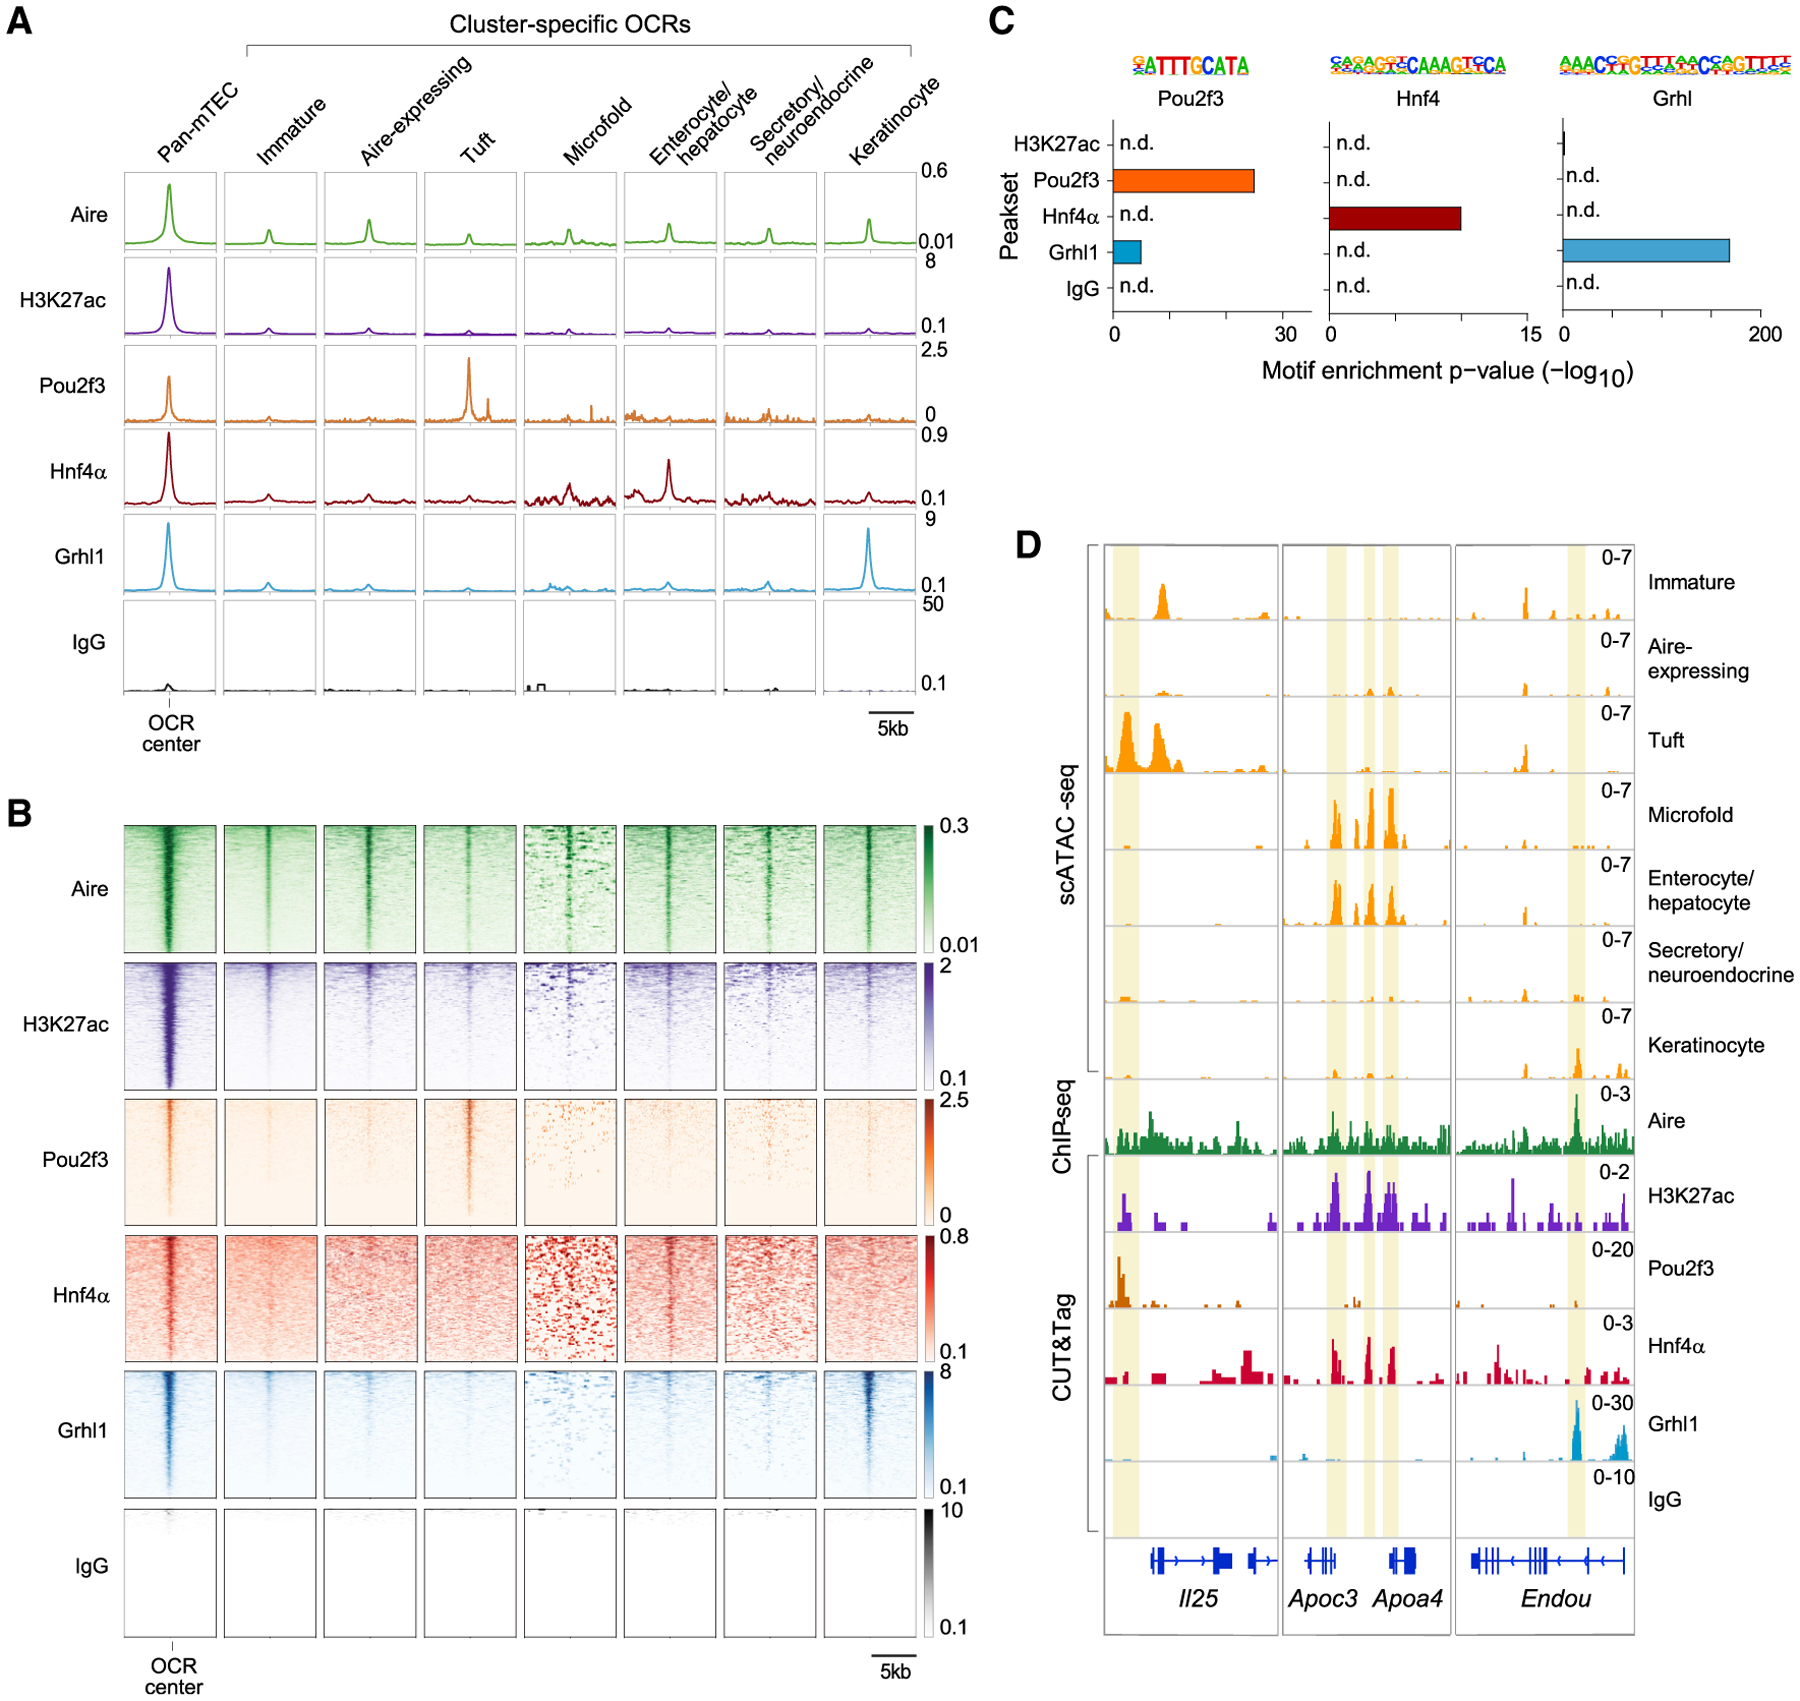
Figure 4. Lineage-defining TFs bind to mimetic-cell OCRs.

(A and B) Profile plots (A) and heatmaps (B) of binding of the indicated factors to the indicated OCRs previously defined by scATAC-seq, assayed by CUT&Tag (H3K27ac, Pou2f3, Hnf4α, Grhl1, and IgG) or ChIP-seq (Aire). For profile plots, mean signal is shown. For heatmaps, each row is one OCR.
(C) TF-motif enrichment in the peaksets of the indicated factors.
(D) Genome tracks showing chromatin accessibility in mTEC subtypes (yellow) and binding of the indicated factors at the indicated loci. In (A), (B), and (D), signal is in CPM and was merged from n = 2 (Aire, H3K27ac, and IgG), n = 3 (Grhl1), n = 4 (Hnf4α), or n = 8 (Pou2f3) independent replicates.
