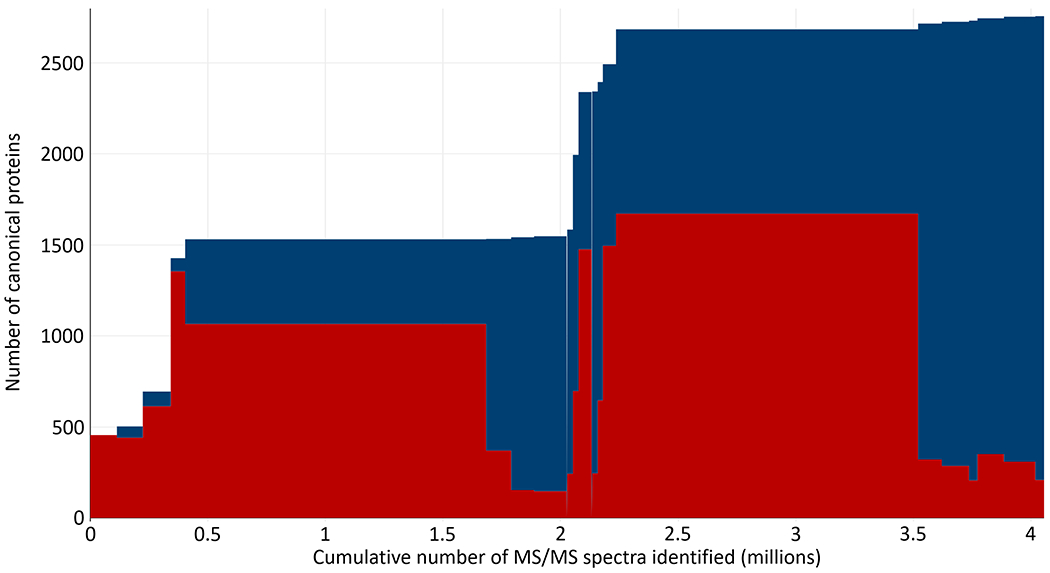
Figure 2. Number of canonical proteins as a function of MS/MS spectra added to the Human Blood Extracellular Vesicle PeptideAtlas build.

Each rectangle represents one experiment; the width of the rectangle is the number of identified PSMs in the experiment. The upper blue extent indicates the total number of canonical proteins assembled in the build. The lower red rectangles represent the total number of canonical proteins in each experiment.
