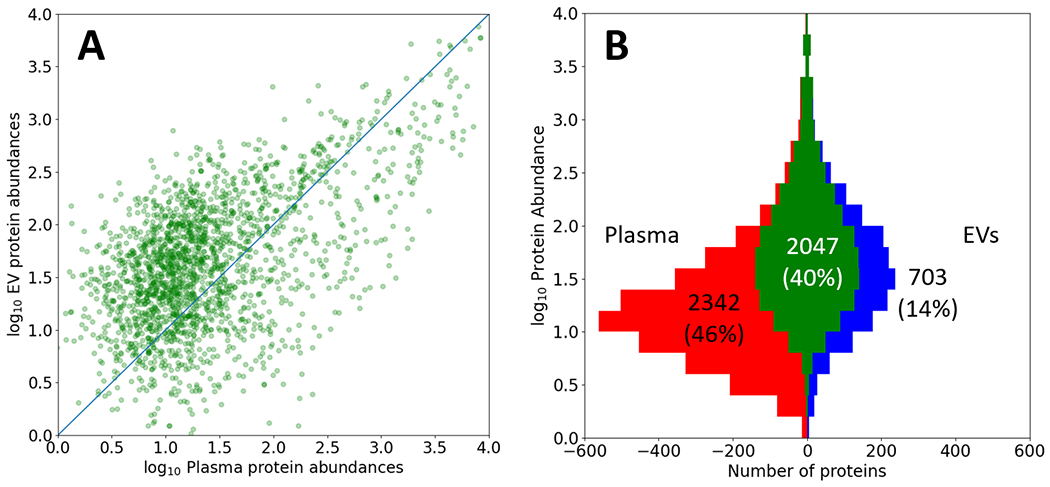
Figure 3. Comparison of the Plasma and EV build protein abundances.

A) Comparison of log10 EV protein abundances vs log10 Plasma protein abundances for the 2047 proteins in common between the two builds. The abundance estimates are based on overall PSM counts and are arbitrarily scaled. A diagonal line of equivalent abundance is overlaid. B) A Venn-like diagram depicting the overlap (central 40%) of proteins in the Plasma (left) and EV (right) builds, stratified by log10 protein abundance estimates based on PSM counts on the y-axis. The plasma build has 10 times as many PSMs and therefore more proteins detectable at lower abundance.
