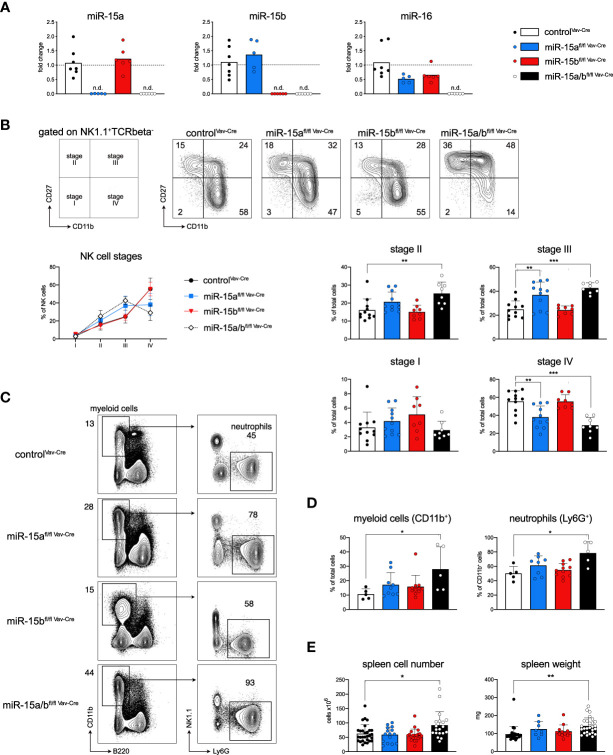
Figure 1.
Hematopoietic deletion of miR-15a/16-1 and miR-15b/16-2 blocks NK cell development and promotes the accumulation of myeloid cells. (A) Quantitative PCR for the expression of mature miR-15a, miR-15b and miR-16 in B cells derived from miR-15a/b+/+ Vav-Cre, miR-15afl/fl Vav-Cre, miR-15bfl/fl Vav-Cre and miR-15a/bfl/fl Vav-Cre mice. Each dot represents the data derived from one mouse. n.d. = not detected. (B) NK cells defined as NK1.1+TCRbeta- were classified as stage I to stage IV based on their expression of CD27 versus CD11b (schematic left panel and contour plots, numbers indicate the percentage of cells within the respective quadrant). The line and bar graphs show the analysis of all data sets for the depicted genotypes, and again each dot represents data from one mouse. (C) Schematic illustration of the gating strategy and representative primary data for myeloid cells and neutrophils in spleens derived from all genotypes. Numbers indicate the percentage of cells within the respective gate. (D) Bar graphs show the percentages of indicated populations within total cells or CD11b+ myeloid cells for all analyzed mice. (E) Bar graphs indicate the total splenic cell numbers and spleen weight for the respective genotypes. Each dot represents the data derived from one mouse. Error bars depict the standard deviation of the mean. Sample groups were statistically compared as indicated by an unpaired two-tailed Student’s t-test. *P < 0.05; **P < 0.005; ***P < 0.0005.

